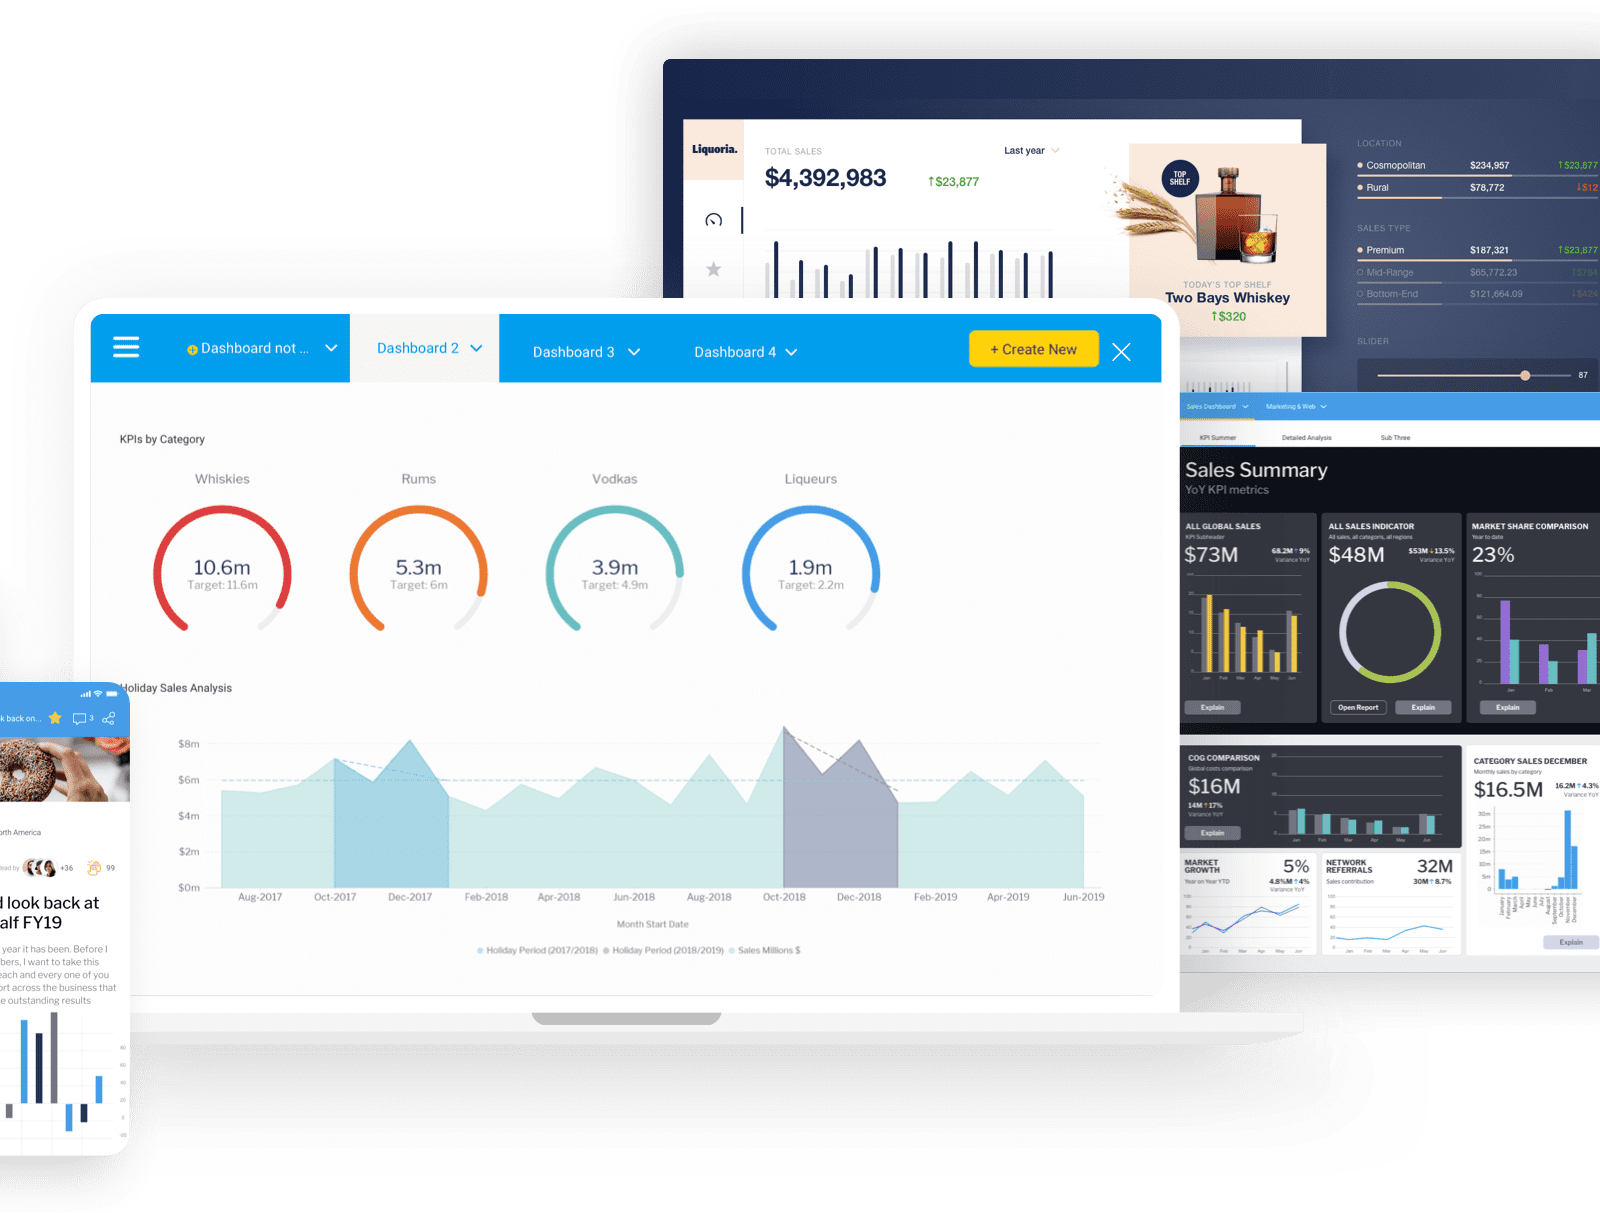
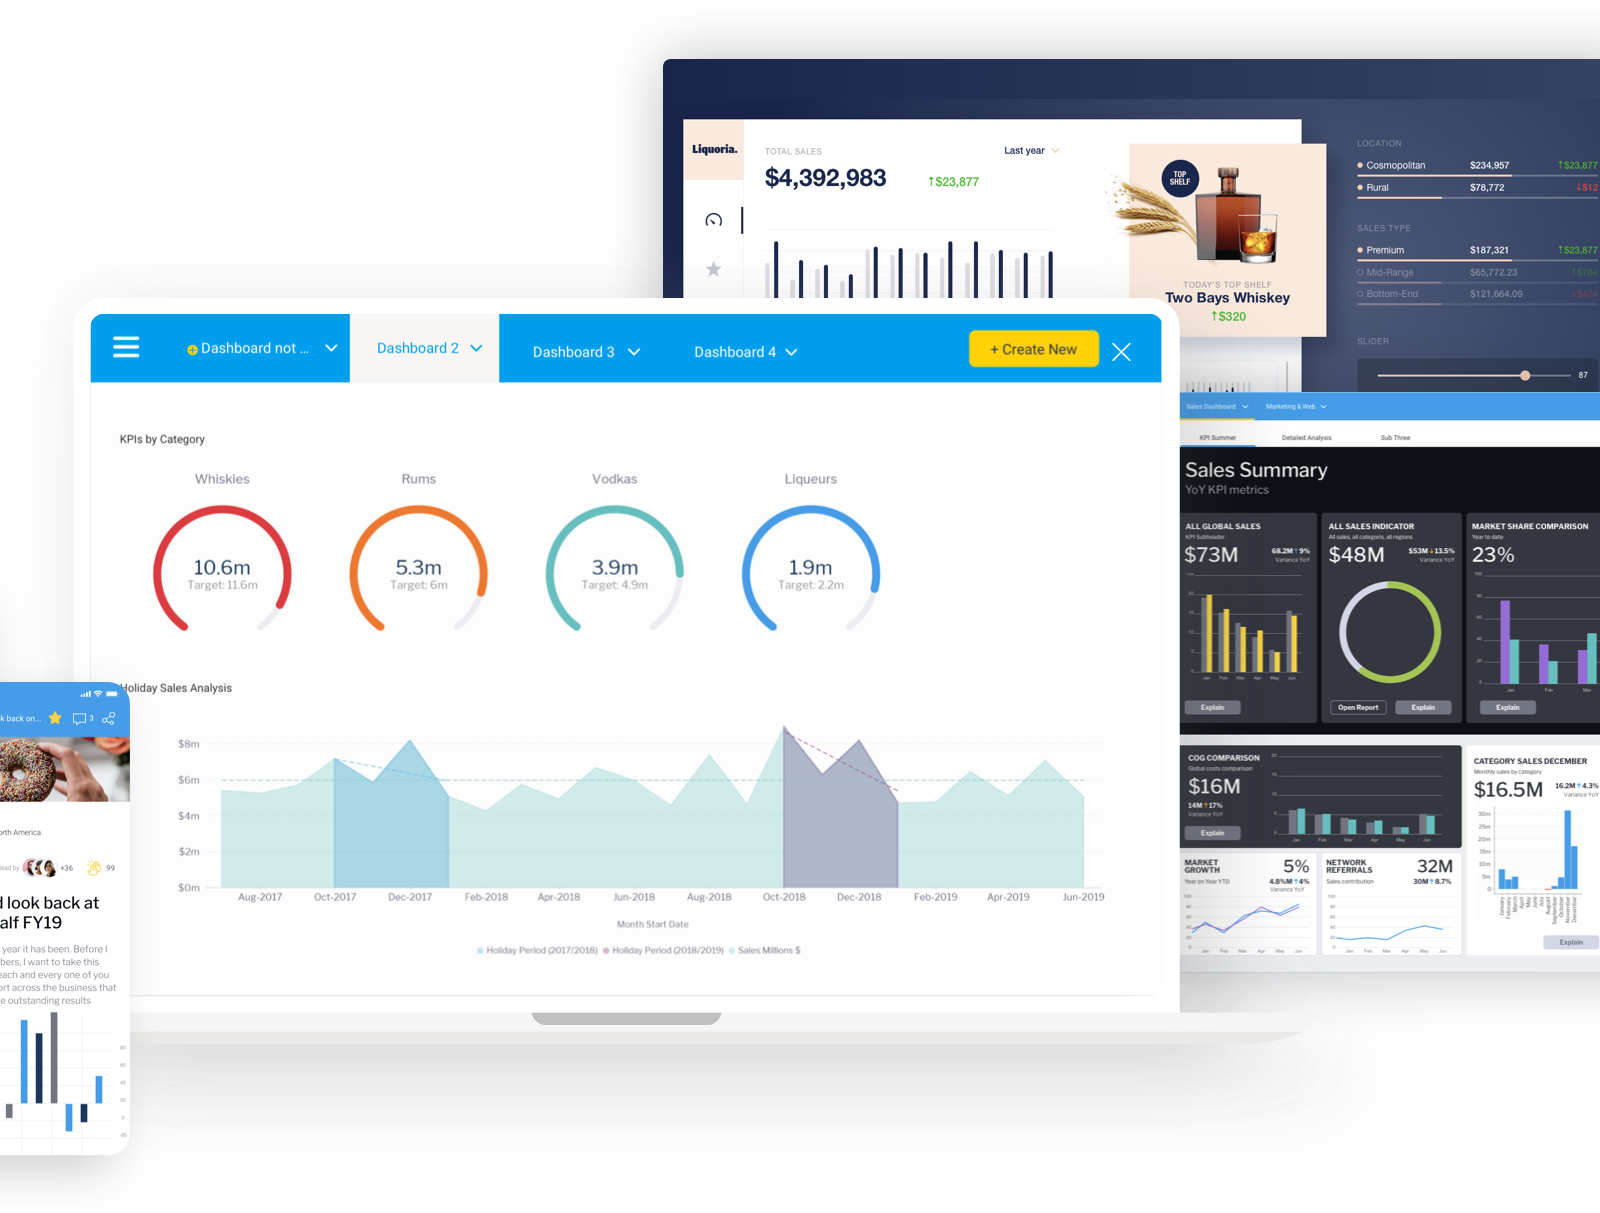
Dashboards have dominated the BI and analytics scene for over 30 years and have been the core requirement in any analytics solution. They have become the default for presenting data to business users to help them monitor and understand their business better. Their goal was to empower the business by providing them with self-service analytics.
However, the dashboard’s current design and usage fundamentally hasn’t changed since the early days of business intelligence (BI) and, as a result, they haven’t adapted to the changing needs of business users. They’ve never fully matured.
There are three stages of dashboard maturity: communicate, analyze, and take action.
Here are what these three stages look like (and why you need to graduate to the third stage asap):
1. Communicate
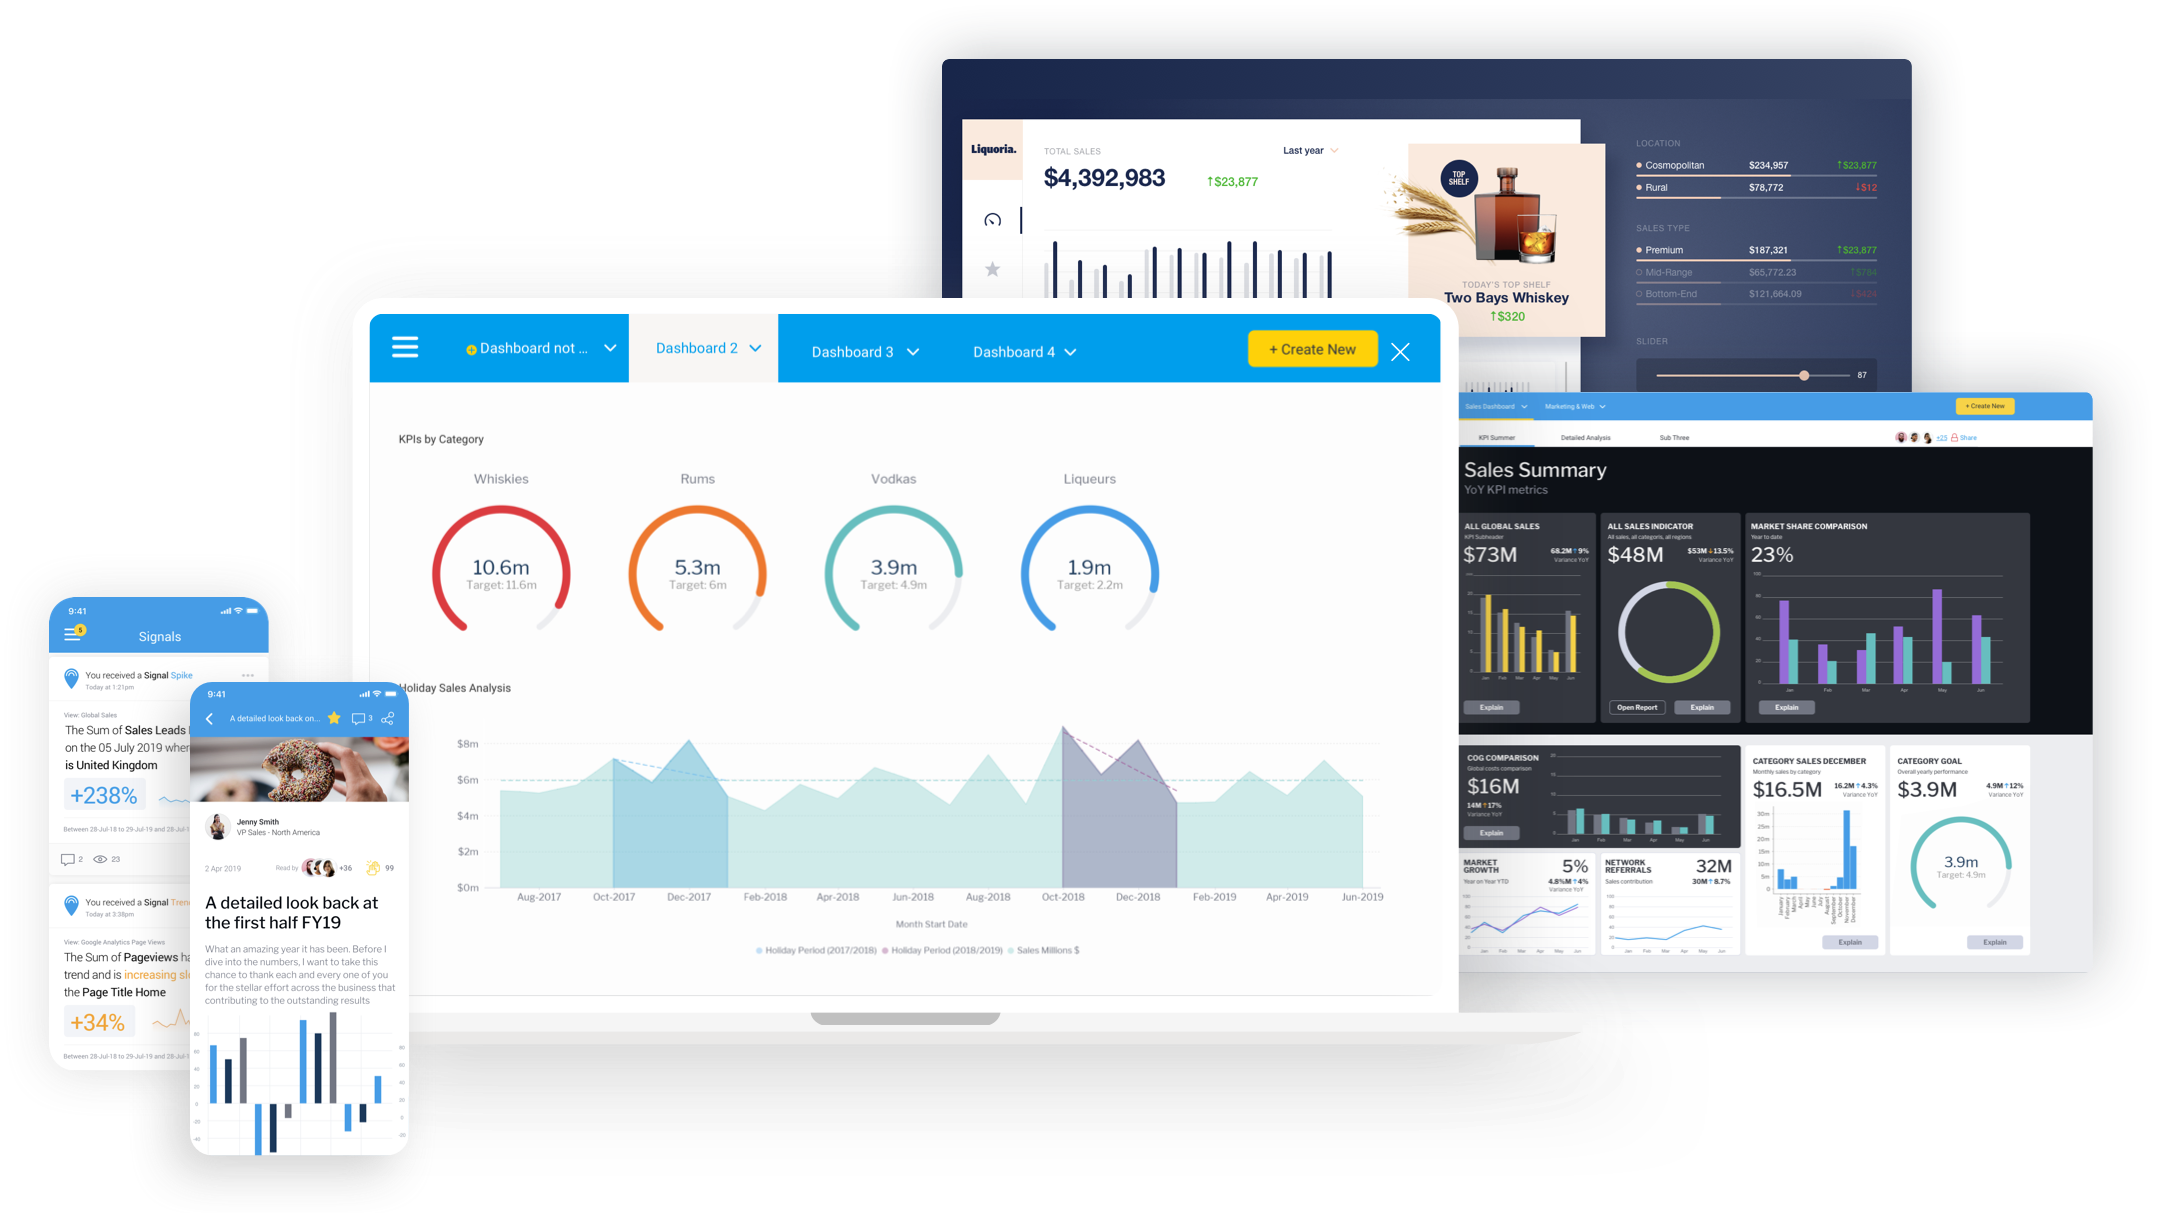
Dashboards were created back when BI and analytics was performed by a team of analysts who had to use complex BI tools to extract data, meaning it took many days to create a single report. Then, to deliver data insights in an easy-to-consume way for the C-suite, several aggregated reports were placed on a one-sheet to give an overview at a glance. Because of the data’s complexity, dashboards and data insights were the domain of the analyst. They were simply designed for communication, not analysis or action.
Today’s traditional dashboards are still communication tools at their core - stage one of dashboard maturity. They communicate KPIs and other high-level, aggregated metrics. They can also communicate more in-depth analyses with filtering and drilling. Ideally, this communication will be received at a glance. Dashboards are a straightforward, graphical way to represent data. But they shouldn’t stop there. There is so much more value to be gained.

2. Analyze (with added automation)
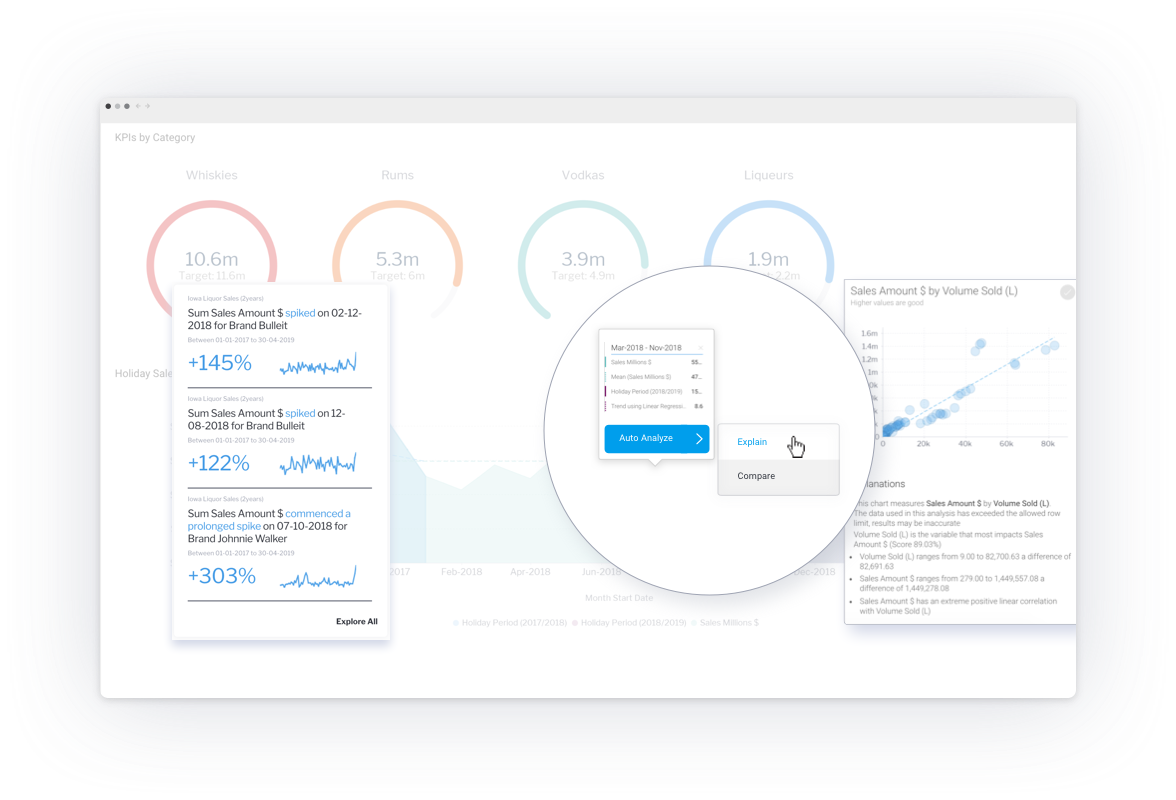
With drilling and filtering, dashboards today also offer analysis - stage two of dashboard maturity. But the analysis process can be tedious and time-consuming, so it’s not user-friendly for your typical business consumer.
However, with the new wave of machine learning and AI, there are better options for data discovery becoming available, like natural language query and automated assisted insights. These can be accessed directly from the dashboard and help uncover the changes in the data that would take a long time to uncover manually.
This type of automation technology can also uncover data changes that would be almost impossible to identify without the power of a machine due to the vast volume of data that would need to be analyzed. Plus, changes in business data may occur in a small subset of the aggregated total shown on the dashboard, for instance, and these can be picked up by this type of augmented analysis though the change might be visible on the dashboard.
Many dashboard platforms are now delivering these sorts of automated analysis options for users. But the third stage - take action - has remained elusive (despite the marketing hype of ‘actionable’ dashboards).

3. Take action
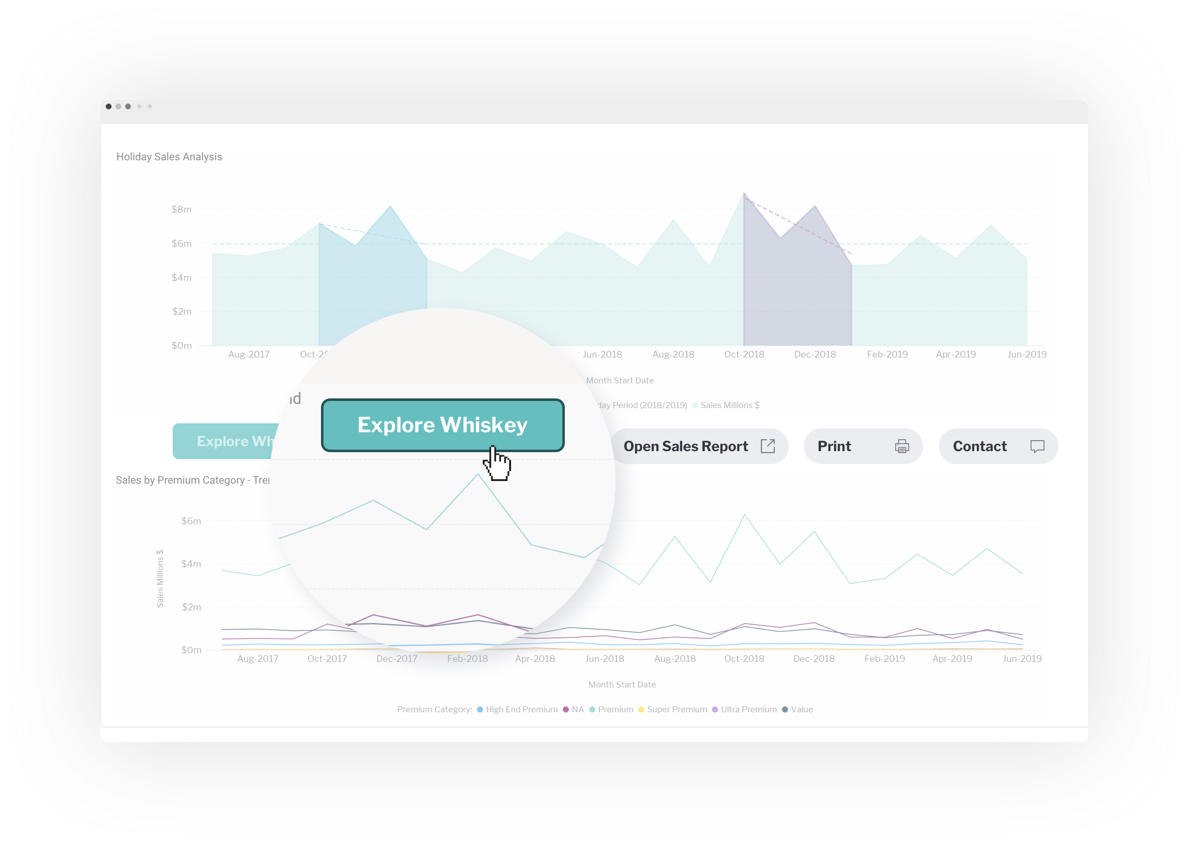
The problem with traditional dashboards, and even those that have automated insights and machine learning-based search query functions, is that once you have the insight, you typically have to switch applications to implement it. You can’t take action directly from the dashboard. The workflow is broken.
To ensure dashboards reach stage three of maturity - driving action - modern dashboards should be a seamless part of the end user’s workflow. We’re not talking about embedding dashboards into applications, but embedding actions into the dashboards themselves.
Picture an e-commerce retailer. The purchaser looks at their dashboard with their stock levels and sees that the one new product (SKU) is close to selling out - an unprecedented surge in sales has caused an urgent need. Right next to the SKU stock report on the dashboard is a button that, when clicked, passes the SKU number, quantity, and other order details to the order system to initiate a stock order. The insight was able to be actioned without even leaving the dashboard.
You can code the button, form, or other action using a combination of JavaScript and the drag-and-drop GUI. Drag a button or form onto the dashboard canvas and code its function using Code Mode.
Time to graduate your dashboards to stage 3
It’s time to fix the broken workflow.
You can now access the code behind the dashboard in Yellowfin. Get your in-house developers to code actions into your dashboards so your users can implement insights at a click.
Data makes sense when there is an action tied to the insight.
If I can fill out a Salesforce form when I want to update a record, or stop an advertising campaign in Google Ads with a button click on my dashboard, I’ll be using my dashboard constantly.
And that’s what you want, right? For your dashboards to be adopted into daily workflows.
It’s time to graduate your dashboards to stage 3. It’s time to make your dashboards truly actionable.
Automate action in your dashboards
Get the full guide to making your dashboards actionable with automation.
