
Welcome to the latest entry in Yellowfin Japan’s ‘How to?’ blog series!
This series of blogs aims to provide your team with another hands-on example of adding data visualization to your Yellowfin dashboards, using our array of chart and graph types.
In the previous blog, we created a Combination Chart by aggregating on the basis of Year and Month. We now have created all the charts we want to be displayed on our final example dashboard, but in this article, we will take a brief detour to implement an analysis feature that will help create a more useful dashboard. This is called Drill Through.
Note: Throughout this series, field names will be written in [square brackets], Yellowfin settings and selections will be written in "double quotations", and parameters that must be entered manually will be written in enclosing lines and shadings. No specific rules are defined for (rounded brackets) or ‘single quotations’, so please read them as normal punctuation marks.
Let's quickly break down what a Drill Through is before we head into our walkthrough.
What is the purpose of a drill through?
A drill through is a technique used in data analysis to explore your data in more detail. BI solutions provide drill through as a standard analysis feature, which allows dashboard users to click on a specific data point and dive deeper into its underlying information. For example, if a user clicks on a sales figure for a particular product in a dashboard, using drill-through will allow them to move from one report to another, revealing a greater level of detail, such as sales data by region, customer, or sales representative.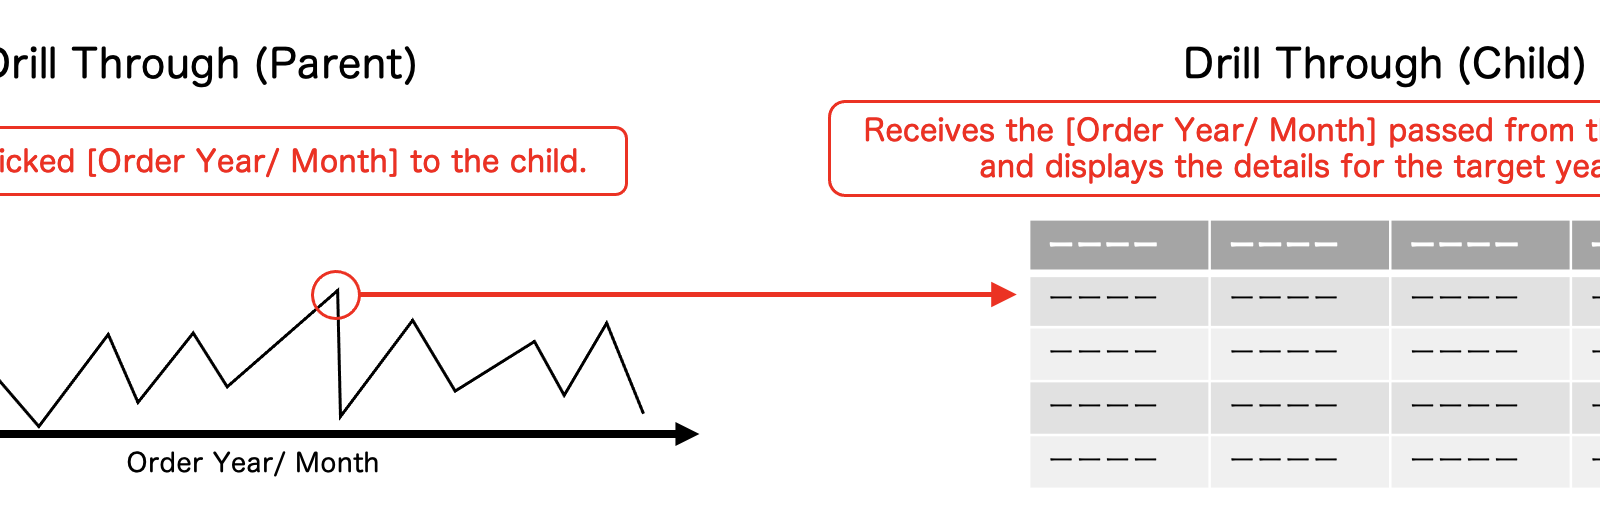 The above figure describes the mechanism of drill through.
Drill-throughs are best used for exploring data in detail when you need to understand the underlying factors behind a specific data point, investigating anomalies or outliers to discover why a particular value is significantly different from the norm, and analyzing trends: to identify patterns or changes over time at a granular level.
The above figure describes the mechanism of drill through.
Drill-throughs are best used for exploring data in detail when you need to understand the underlying factors behind a specific data point, investigating anomalies or outliers to discover why a particular value is significantly different from the norm, and analyzing trends: to identify patterns or changes over time at a granular level.
What are drills?
Drill through falls under the umbrella of drill, a general term used to encompass different levels of data exploration that help analytics users move from a high-level view to a more granular one. The best way to differentiate the different drill options is as follows: Drill-down: This involves moving from a summary level to a more detailed level within the same dimension. For example, drilling down from total sales to sales by region. Drill-up: This involves moving from a detailed level to a more summary level. For example, drilling up from sales by product to total sales. Drill-across: This involves moving from one dimension to another within the same data set. For example, drilling across from sales by region to sales by product. Essentially, drill-throughs are a powerful tool for gaining a deeper understanding of your data and making data-driven decisions. With the term now defined, let's move onto creating a fresh example report, for the purposes of demonstrating the drill through feature in Yellowfin.Step #1: Creating a table
We will again create a report by selecting the order history view that we created in #3 of the series. Since this is a report for order details, let's create a table that lists the Order Dates and Items ordered. The fields to be used are [Order Date], [ASIN], [Product Name], and [Invoiced Amount]. Add each of these to the Column. If you create a Drill Through, the report to which you are drilling through (child) will need to be filtered. As shown in the figure above (mechanism of Drill Through), add [Order Year/Month] to the Filters in order to receive [Order Year/ Month] from the Drill Through source (parent). Since only one [Order Year/ Month] will be received in the Drill Through, select "Equal to (=)" as the "Operand".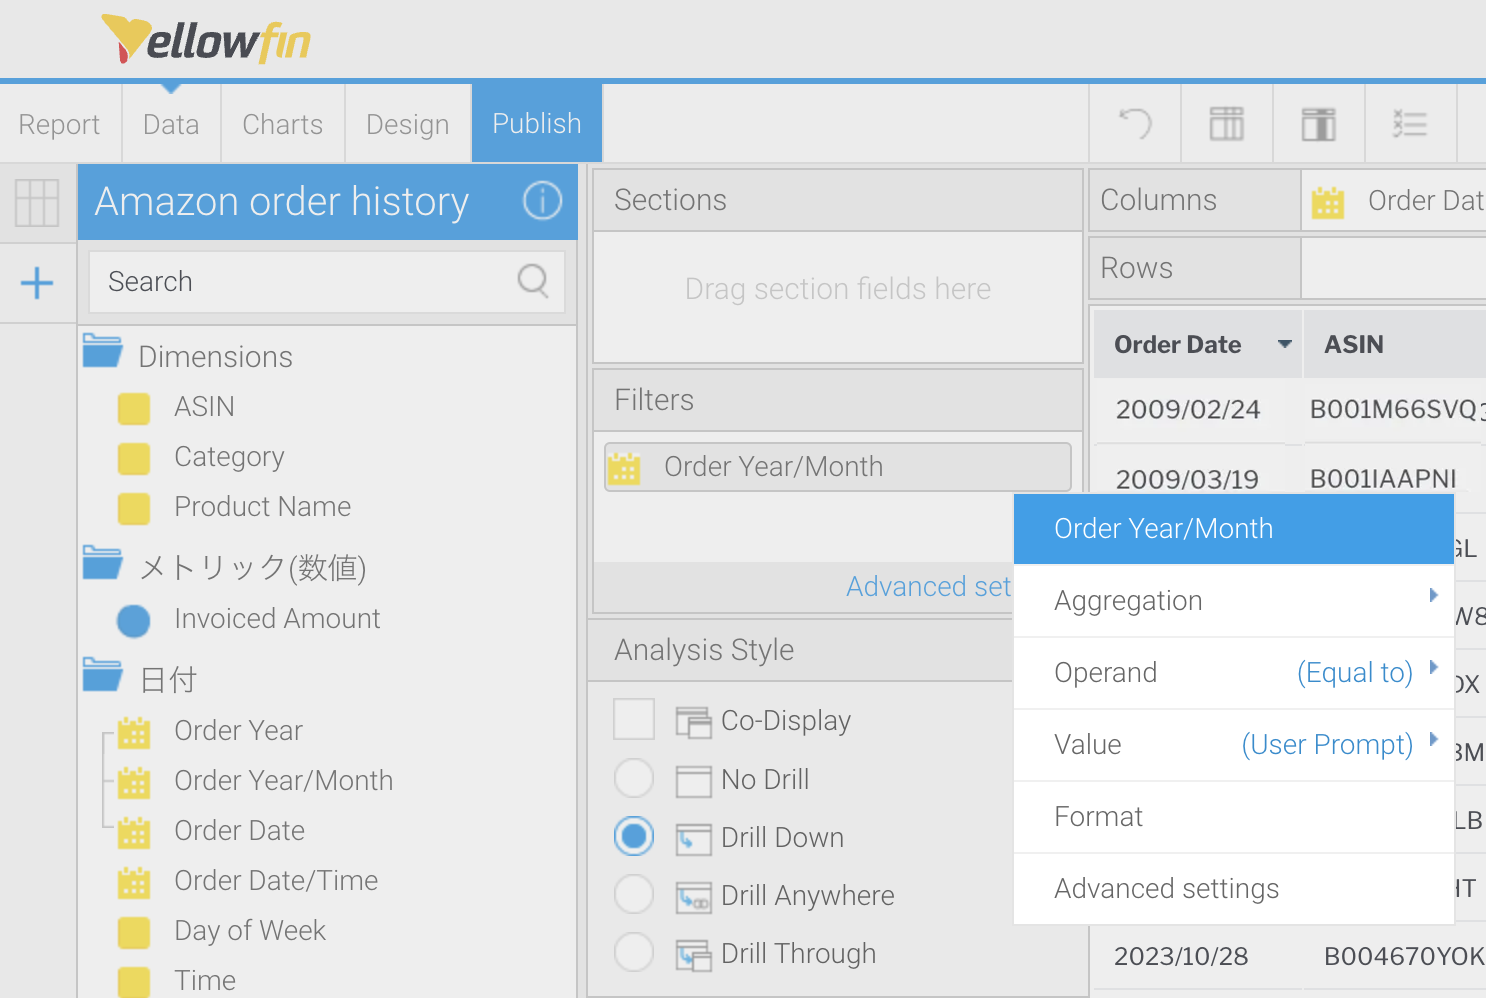 Set the filter operand to "Equal to (=)".
Change the Display of the [Sum Invoiced Amount] to Invoiced Amount, and the table is complete.
Set the filter operand to "Equal to (=)".
Change the Display of the [Sum Invoiced Amount] to Invoiced Amount, and the table is complete.
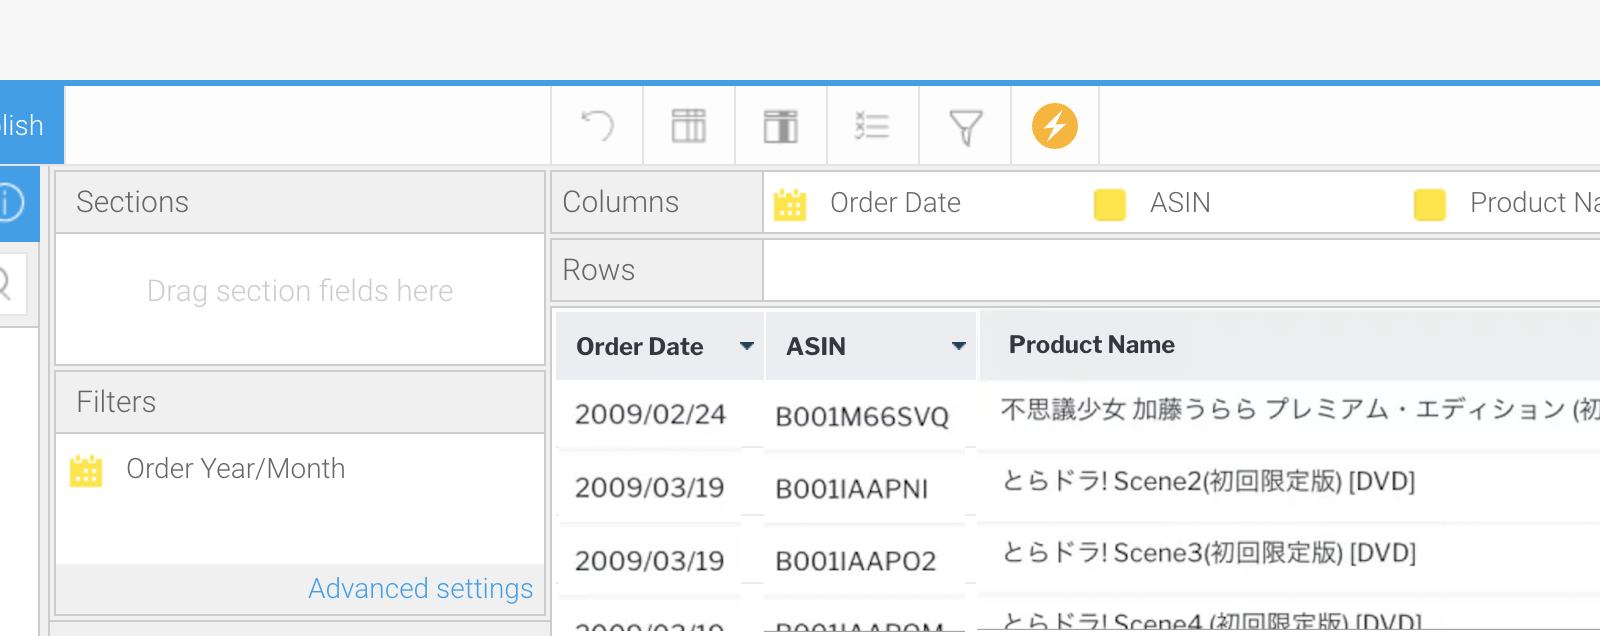 Here is the completed image.
You have now created a report of Order Details. Click the Publish button to save the report, before we proceed to the next step of performing a drill through.
Here is the completed image.
You have now created a report of Order Details. Click the Publish button to save the report, before we proceed to the next step of performing a drill through.
Step #2: Setting up Drill Through
Drill Through settings are made in the Drill Through source (parent) report. Edit the report for the Combination Chart created in #8. On the report edit screen, set "Analysis Style" to "Drill Through. You will see a menu "Related Content" in the upper menu. Drill Through settings are made on the "Related Content" screen. In the "Related Content" screen, thumbnails of reports are listed on the left side of the screen. By entering the name of the report in the search window, you can easily find the (child) report you want to Drill Through to. In the center of the screen, there is a box labeled "Drill Through". Drag and Drop the thumbnail of the Order Details report into this box to configure the Drill Down settings.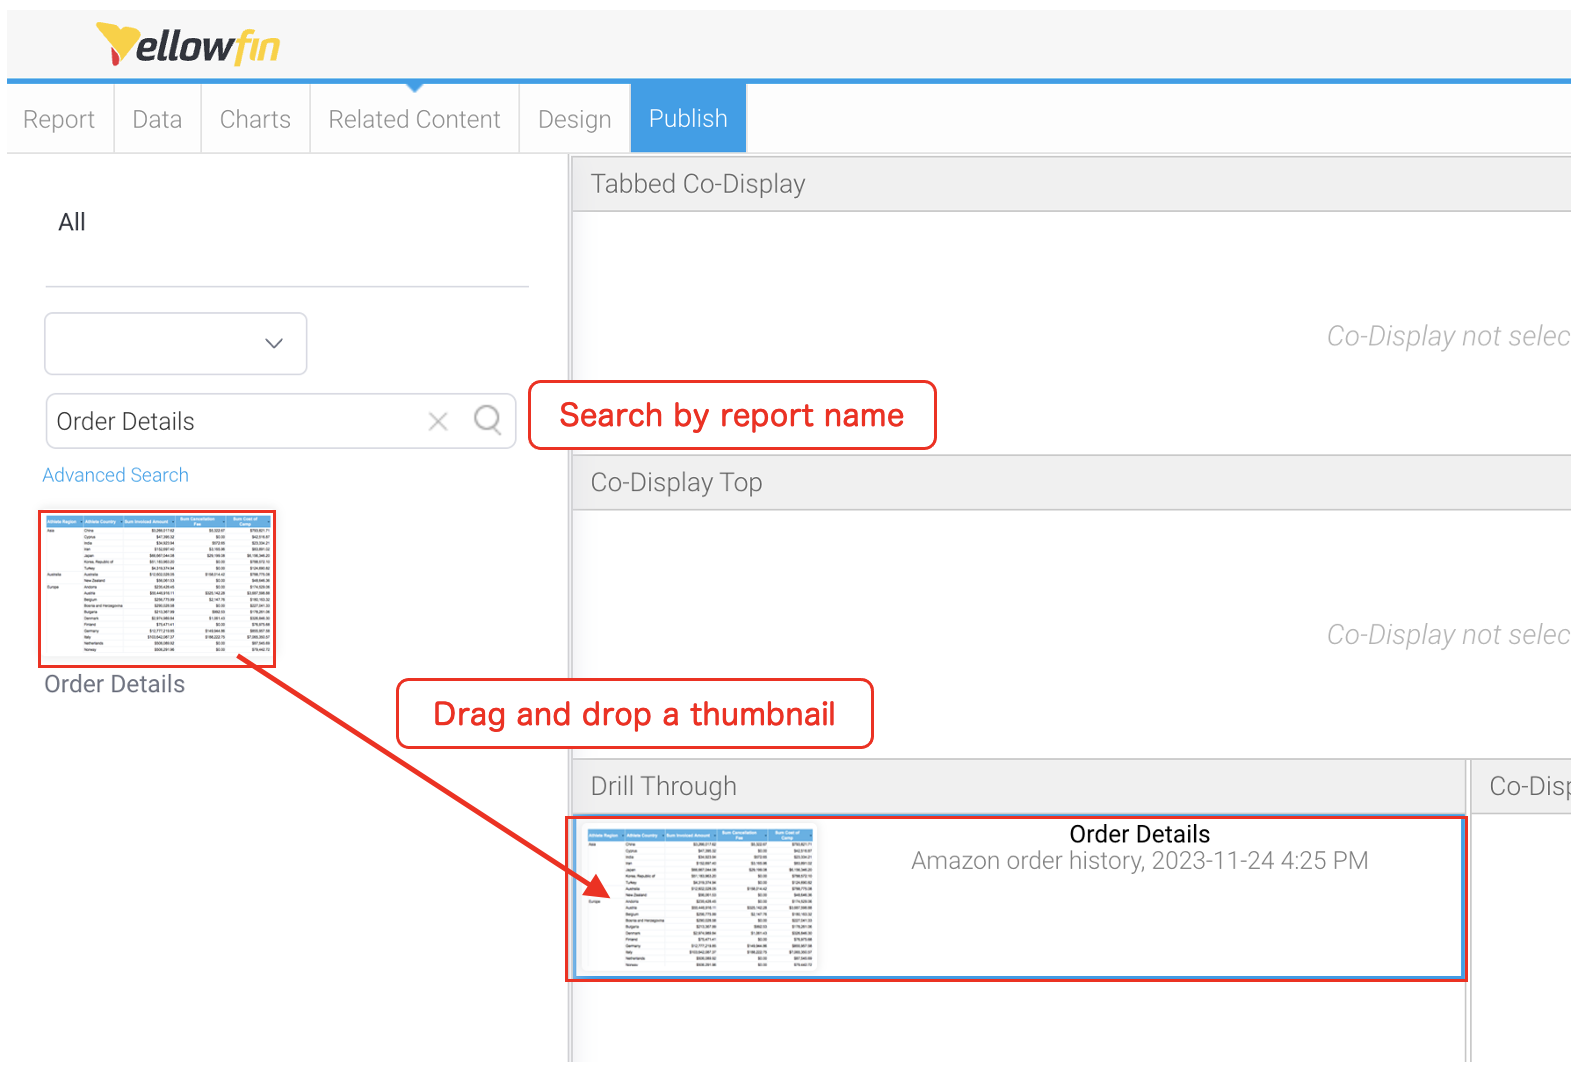 Drag and drop the report to the Drill Through box.
In the settings panel on the right side of the screen, set [Order Year/ Month] in the "Master Field" and "Hyperlink Field" respectively, check the "Popup New Window" checkbox, and click the "Update" button to complete the Drill Through settings.
Click the "Publish" button to save the report.
Drag and drop the report to the Drill Through box.
In the settings panel on the right side of the screen, set [Order Year/ Month] in the "Master Field" and "Hyperlink Field" respectively, check the "Popup New Window" checkbox, and click the "Update" button to complete the Drill Through settings.
Click the "Publish" button to save the report.
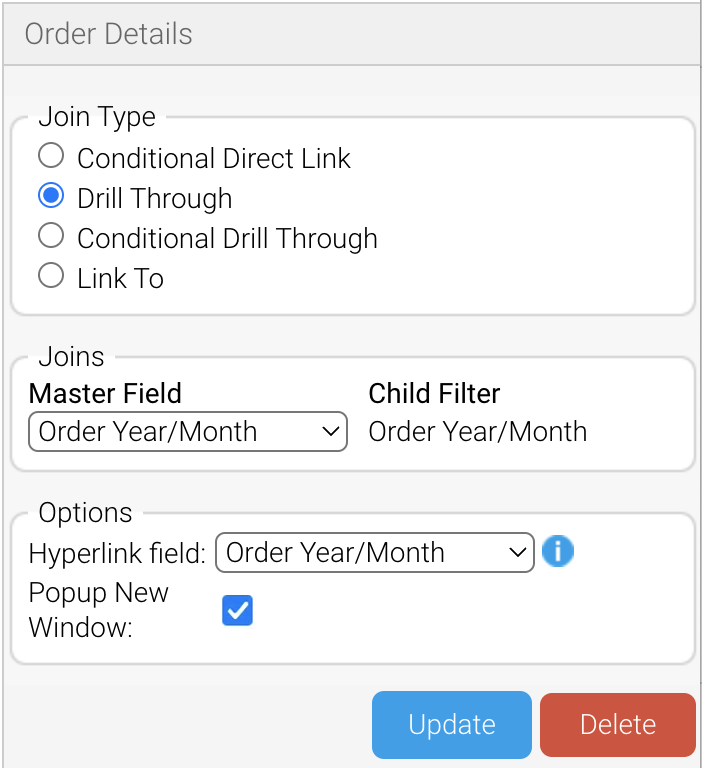 Here is the detail for setting up the Drill Through.
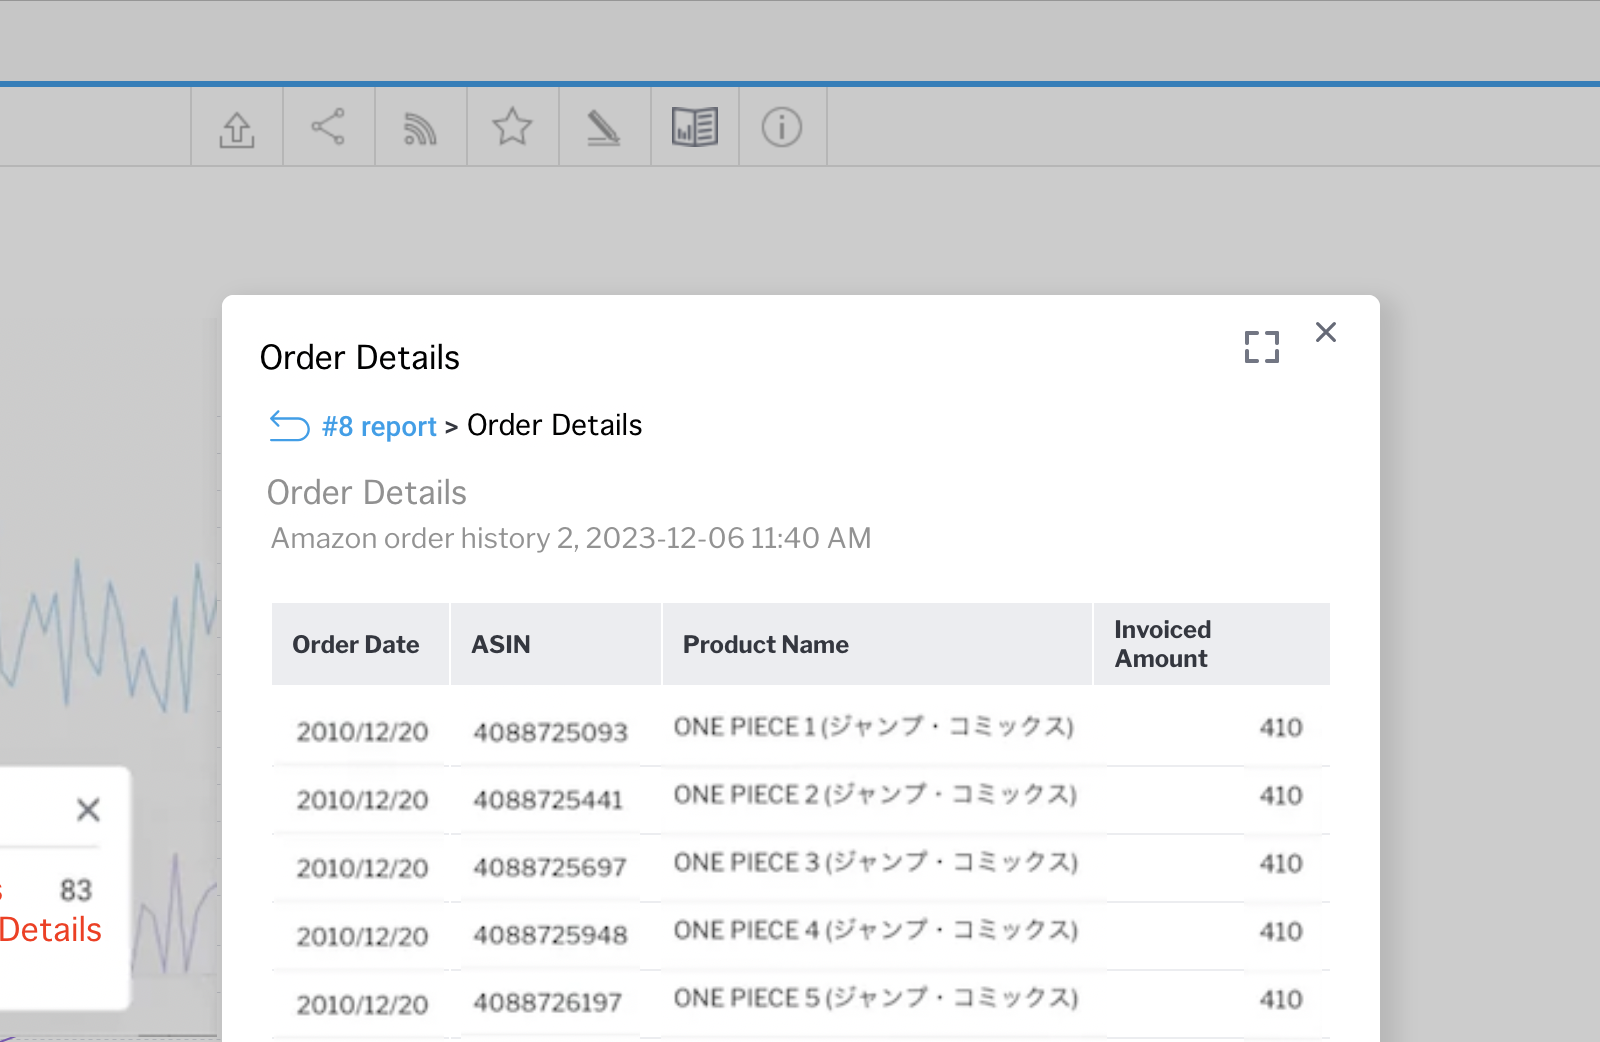
Once you publish the report, make sure the Drill Through works, as pictured.
Here is the detail for setting up the Drill Through.
Once you publish the report, make sure the Drill Through works, as pictured.
 In the next blog, we will finally get to the final part of the series! We will create a dashboard incorporating all of the features and techniques we have covered in the Yellowfin Japan 'How-To' blog series so far. Stay tuned!