

Self-Service Analytics: 5 Key Benefits and Improvements
Self-service analytics, also known as self-service business intelligence (BI), is an ideal solution to open up the process of accessing, analyzing and sharing data to both non-technical users (customers, staff) and data experts (IT, developers, analysts) alike.
Providing analytics that offer self-service BI, characterized by low code, no code platforms and features, is critical to scale up the benefits of data-driven decision-making to more than just those who already have advanced knowledge of data and analytics.
However, the concept of self-service analytics is understandably still new to many businesses, including what benefits it brings. In this article, we list 5 key benefits of self-service analytics, to help your team understand how it helps, and why you need it today.
Self-Service Analytics vs Traditional BI: Recap
We previously covered what self-service analytics is in our in-depth guide, which we highly recommend reading before continuing with this blog.
In brief summary, self service analytics describes a modern approach to data analytics that empowers both non-technical and technical users of analytics tools to be able to view, explore and share their data without needing extensive expertise or knowledge to actually use said tools.
Historically, analytics solutions have been created with data analysts or data experts in mind. This has meant deeper analysis of data, and access to it, has often been limited to a small number of people in a business, preventing development of a data-driven culture.
It has also meant business users typically rely on IT teams or data experts to explain data and reveal insights for them. This has led to a number of consequences, including:
- Putting the analytic workflow burden and responsibility entirely on technical departments, who have less time to focus their efforts on other important areas of the business
- Making users and customers have to submit requests to the IT team everytime they need a dashboard or report created, modified or explained to them
- Preventing more people (customers, internal non-technical users, etc) from being able to use their business data independently for decision-making and insight discovery
The pivot toward creating analytic tools usable by both advanced and regular users aims to remove these traditional barriers and create data-driven workflows. The other many benefits self service analytics brings are also significant - you can learn more about them below.
Self-Service Analytics: Why You Need It Today
The reality is the people who need data the most are probably not already specialized in data and analytics. Legacy BI tools demand technical knowledge in data engineering or SQL to navigate their UI, meaning access to data and any insights within are left to a small number of experts.
The result?
Most people either have to wait for their help to build or analyze reports, make do with static spreadsheets, or worse - make decisions not based on any form of hard data.
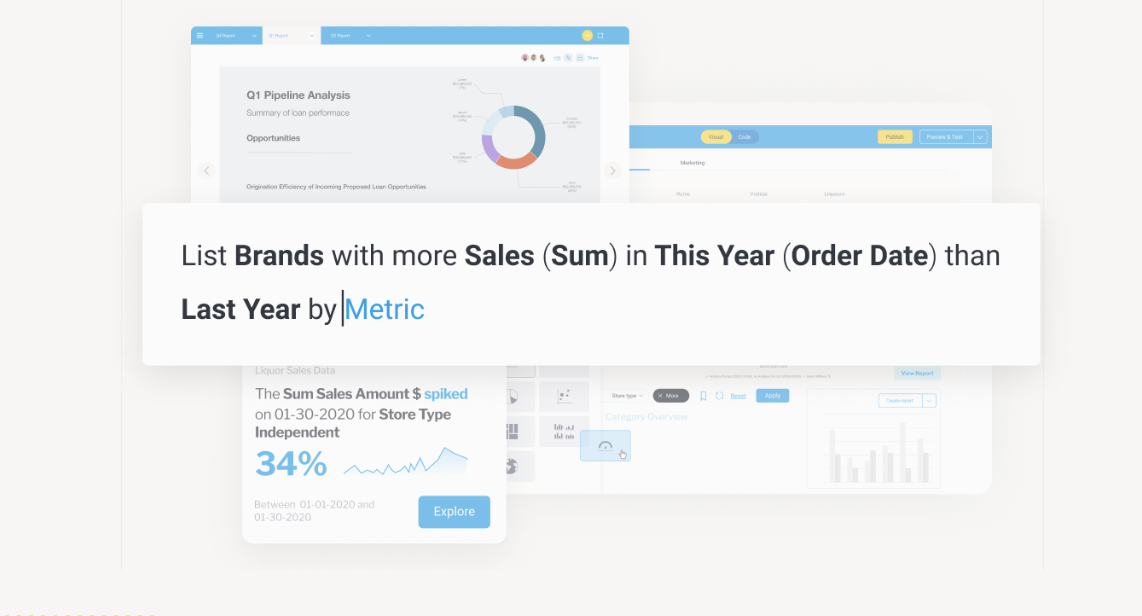
What self service BI does is help empower these non-experts to make more business decisions, because the process of viewing and analyzing data is now made more available and easily done. This is achieved through a combination of methods, from the integration of sophisticated AI analytics (also known as augmented analytics) tools that streamline querying or analyzing data such as Yellowfin Guided NLQ, to automated business monitoring tools like Yellowfin Signals which auto-alert your users to changes in data.
The model of self service analytics is important to understand today as it is rapidly driving a new model of analytics user, called the augmented consumer. This essentially describes a class of analytics user that can independently access and analyze data, without help from IT or data experts, and also perform the following types of data analytics unassisted.
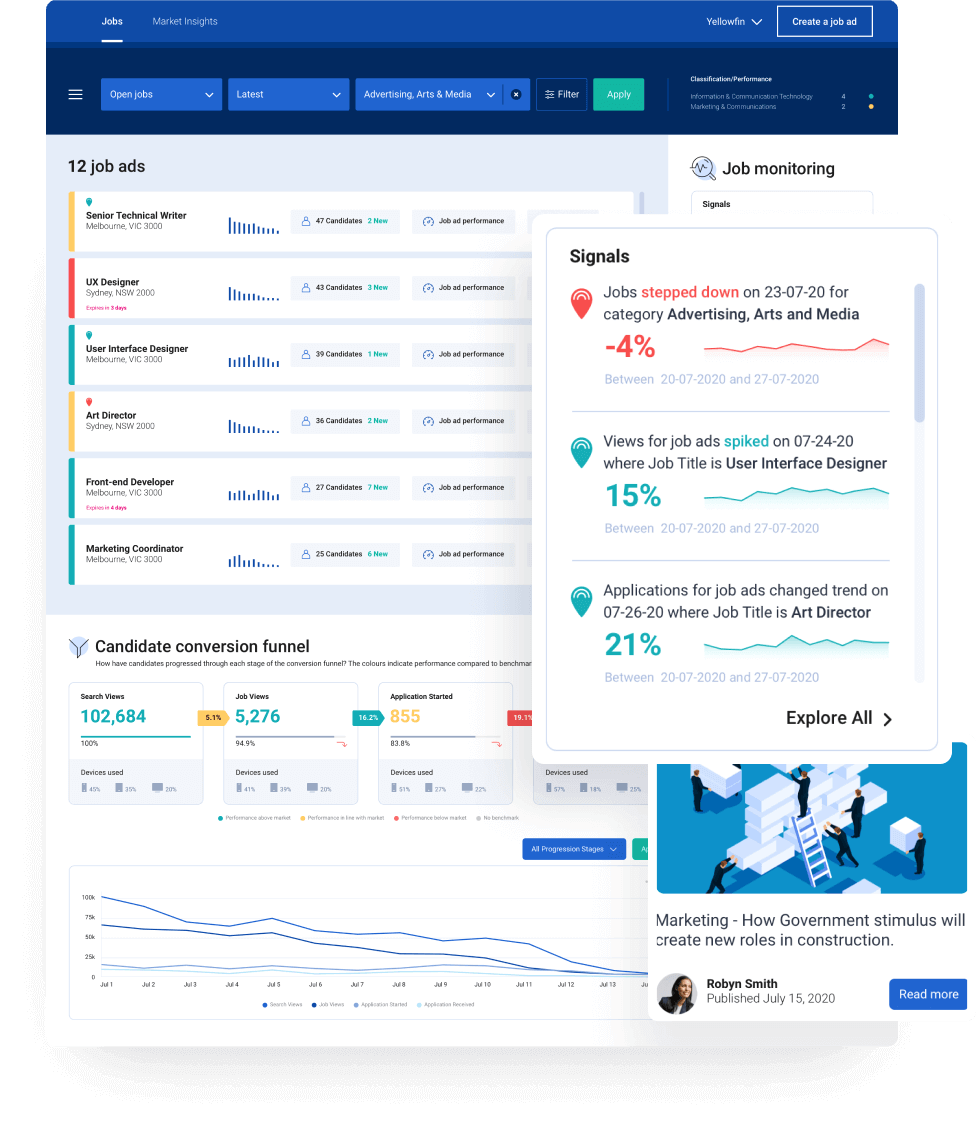
Yellowfin dashboard using automated tools to provide a self service analytics experience.
Types of Data Analytics
Data analytics is divided into 4 main categories, and each of these types is made simpler by using self-service analytics. Here are the primary different types of data analytics:
Diagnostic Analytics
Diagnostic analytics focuses on understanding why events occur. It delves into past data to uncover patterns and relationships, helping businesses identify the root causes of issues or successes.
Diagnostic analytics provides insights into trends and anomalies by using techniques like data mining and drill-down analysis. This type of analytics answers the "why" behind outcomes, allowing organizations to make informed decisions and improve processes for better future performance.
Prescriptive Analytics
Prescriptive analytics goes beyond understanding and predicting outcomes; it provides actionable recommendations. By leveraging optimization techniques and advanced algorithms, this type of analytics suggests the best course of action for a given scenario.
It helps businesses decide "what to do next" to achieve their goals. Prescriptive analytics combines historical data, predictive models, and real-time information to deliver precise and practical solutions for complex problems.
Predictive Analytics
Predictive analytics uses statistical models and machine learning to forecast future outcomes. By analyzing historical data, it identifies trends, patterns, and potential risks. This type of analytics answers the question, "what is likely to happen?"
Businesses use predictive analytics for customer behavior forecasting, risk assessment, and market trend predictions. It empowers organizations to make proactive decisions and stay ahead of potential challenges.
Descriptive Analytics
Descriptive analytics summarizes historical data to reveal what has happened over a specific period. It uses data aggregation and visualization tools like charts and dashboards to present trends and insights.
This type of analytics helps organizations understand their past performance and current status. Descriptive analytics lays the foundation for more advanced types of analysis, serving as the first step in the self-service data analytics process.
What are the Benefits of Self-Service Analytics?
Benefit #1 - Self-Service BI Democratizes Data for Everyone
The most important benefit of self service analytics is it democratizes data for everyone.
Legacy BI tools severely limit the access, exploration, and analysis of data to a small number of technical elite in a business. What self-service BI tools aim to do is open up the ability for regular business users to be self-sufficient in their data needs.
This means your users and customers, regardless of existing knowledge or technical skills, can more readily access, analyze, and build dashboards and reports and obtain insights if they need it, when they need it (such as when they need to support a decision). There’s no need to wait for analysts to explore data for them; they can do it themselves.
Most enterprise companies struggle to get their users to leverage business data - for instance, from a KPI and dashboard report - based on the fact that that data has been traditionally siloed away from them due to inaccessible, overly technical analytics toolsets. That is rapidly changing with modern self-service BI solutions like Yellowfin - and so should your deployment.
Benefit #2 - Self-Service Analytics Increases Agility and Efficiency
Legacy BI tools often give no choice to regular users but to wait for their queries and report requests to go through IT, rather than be able to build their own. The challenge of this approach is that data is often outdated by the time it gets to the user or not needed anymore, and often results in the user acting without data entirely up-to-date or available.
Self-service BI means the process of accessing data or building a report or running a query is essentially available on-demand for the individual user. Whatever the user’s role (C-suite, marketing, sales, management, etc) or skill level (expert, intermediate, beginner), self-service BI tools are streamlined and tailored to allow more people to explore data, analyze it for trends or patterns, and identify insights and actionable opportunities that they otherwise would have to wait for an expert to do. There is no longer a delay in the analytic process, improving overall agility and efficiency to make important decisions.
Read More: How Yellowfin Guided NLQ Unlocks True Self-Service Analytics For Everyone
Benefit #3 - Self-Service Analytics Provides a Single Source of Truth
A self-service analytics solution helps ensure every customer or user engaging with your BI tools has access to and explores the same version of your business critical data.
Instead of having to rely on using multiple Word docs, Excel spreadsheets or disparate data from CRM, ERP and HR systems (not to mention further fragmented across different business units/departments) to inform their work, self-service analytics solutions help make sure data is more accurate, consistent and relevant for use.
Self-service BI ensures everyone in the business can access accurate and reliable data that is updated instantly in real-time, improving collaboration, context and productivity.
Benefit #4 - Self-Service Analytics Reduces the Burden on IT
Self-service analytics doesn’t just benefit your analytics users or customers, either.
A majority of legacy BI tools typically require analysts or developers to build reports and dashboards for users, owing to their inherent complexity and lack of streamlined UI.
Self-service BI tools in comparison enable your users and customers to be able to access, create, explore, analyze and share data via reports, dashboards, data visualization and data stories far easier.
What does this mean?
Your expert in-house IT or developer teams will spend less time having to create routine reports or explain data to non-technical people every time they need to find answers. It also means they have more time focusing on other important areas of the business, such as improving data preparation, strengthening data governance, or streamlining the analytics user experience.
Self-service BI platforms also benefit the more technically-inclined users in your business, as the streamlined nature of these tool-sets allows advanced experts to speed up their typical report building, data cleaning and data analysis processes considerably.
Read More: 6 Signs Your Analytics Dashboard is Outdated
Benefit #5 - Self-Service Analytics Guides People Through Data
Making better business-related decisions is only possible by understanding the story beneath the numbers. While self service analytics solutions have opened up the capabilities of dashboards, reporting and data storytelling to more people, just making those tools available isn’t enough for everyone. Some users will need additional guidance in being able to use those tools effectively.
Today’s BI solutions, such as Yellowfin BI, are increasingly designed with the non-technical business user in mind, combining sophisticated technologies such as augmented analytics (artificial intelligence, automation, machine learning) with user-friendly design (low code, no code drag-and-drop UX) to lower the complexity of accessing data and empower more people to be able to explore, analyze and understand their data - and use it for their decision-making efforts.
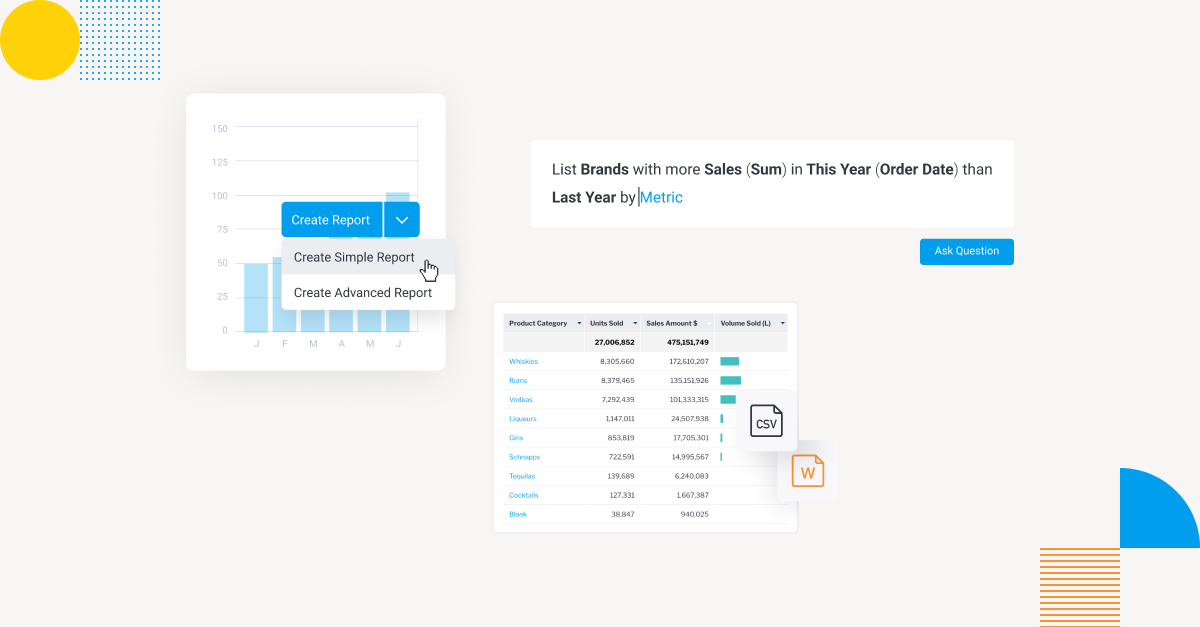
Because your users can create dashboards, build reports, identify trends or share data stories independently, the process of data exploration and data analysis is simplified significantly. For example, Yellowfin’s Guided NLQ features allows users to not only query their data for insights, but get help in pinpointing what parameters they need to use to ask the right question.
Having such a self-service analytics solution in place that is easy to navigate and guides the end-user toward insights or how to use their data means you significantly reduce your users’ reliance on IT or developer teams to produce reports or explain the meaning of data for them.
5 Best Practices of Self Service Analytics to Follow
Here are a few best practices that you should follow when it comes to self-service analytics:
Collaboration is Key
The model of self-service analytics thrives when teams work together. Encourage collaboration between data experts and end users to bridge the gap between technical capabilities and business needs. Regular brainstorming sessions and open communication ensure the analytics tools you have just invested in are able to cater to diverse requirements and business expectations, maximizing their utility and effectiveness.
Taking Feedback and Making Changes
User feedback is a goldmine for improving self service analytics systems. Gather insights from your end users regularly to identify pain points and areas for improvement. Quickly adapting to this feedback not only ensures that your self service tools remain user-friendly, but also fosters trust and engagement within the organization.
Ensure that Data is Easily Accessible
Complicated access procedures can hinder productivity. Simplify data access by creating centralized repositories and using intuitive tools. This ensures that users can quickly locate, retrieve, and analyze their data in your newly adopted self-service BI tool, leading to faster decision-making and fewer bottlenecks in workflows.
Establish Data Governance
Good data governance is the backbone of self-service analytics workflows. Establish clear data quality, security, and privacy protocols to build user confidence. Define access levels, audit data usage, and ensure compliance with industry regulations to maintain a secure and efficient analytics environment.
Create a User-Friendly Interface
The interface of your self service analytics tools can make or break their adoption. Ensure you choose a solution that allows your users to design dashboards and tools that are intuitive, visually appealing, and easy to navigate. We recommend selecting a self service BI solution that offers drag-and-drop features, customizable views, and interactive charts to empower your users of all technical levels to derive insights with minimal training.
Discover more best practices, as well as a detailed comparison between traditional and self-service BI, and steps to prepare for self-service analytics, in our Ultimate Guide to Modern Self-Service Analytics whitepaper.
Frequently Asked Questions (FAQs)
What exactly is meant by self-service analytics?
Self-service analytics enables users without technical expertise to access, analyze, and visualize data independently using user-friendly tools. It eliminates the need for constant reliance on data specialists. Read our guide, What is Self Service Analytics, to learn more.
How does self-service analytics differ from traditional analytics?
Traditional analytics relies heavily on data teams to create reports and provide insights. In contrast, self service tools empower end users to explore data and generate reports, fostering quicker decision-making and greater autonomy.
How does AI & machine learning enhance self-service analytics?
AI and machine learning enhance self service reporting by automating data preparation, providing predictive insights, and generating recommendations. These technologies simplify complex analyses, making insights accessible to non-technical users.
What are the prime business benefits of implementing self-service analytics?
Self service analytics is important because it empowers non-technical users to drive faster data-informed decisions, reduces over-dependence on data teams, and creates a culture of collaboration and innovation. It enhances efficiency by having access to instant insights, enabling the organization to respond swiftly to the needs of the business.
Self-service analytics: How to get started
See how real users today are taking advantage of sophisticated, streamlined, self-service analytics with Yellowfin - or try our free trial.