Self service analytics (also called self-service business intelligence, or self-service BI) is a term commonly used among analytics vendors and organizations adopting BI, often in the context of being the next big thing in driving more people to use data to find insights.
But what is self service analytics?
How does self service analytics work?
And why does self service analytics matter?
In this blog, we explain the meaning of ‘self service’, defined in the context of business intelligence solutions, to help you understand its differences, purpose, and benefits.
What is the meaning of self-service analytics?
Self service analytics is an approach to business intelligence (BI) that enables all analytics users the ability to access, analyze and share their data, discover opportunities and extract actionable insights - without requiring expertise or skills in data or analytics.
Today, there is an increasing reliance on data and analytics to inform business strategies, and requirements for data reporting are changing rapidly and becoming more fluid. This has driven an important shift away from traditional IT-centric reporting to decentralized, self-service tools.
The role of self-service analytics is to democratize access to data across an organization, not just to those who are knowledgeable in data reporting. It aims to empower the average person to participate and have a greater impact on the analytics process so they can improve business outcomes, and use data regularly for informed decision-making.
What makes an analytics solution ‘self service’?
The key difference between traditional self service business intelligence analytics solutions and BI solutions that tout self-service analytics is that the latter provide analysis tools that can be used to explore, visualize and share data quickly and easily, regardless of the user's existing data knowledge or skill level in data and analytics.
Self-service analytics tools are typically characterized as containing the following:
- Augmented analytics capability that streamlines analysis (via automation and AI)
- Flexible and straightforward data connectivity (ample APIs and connectors support)
- Drag and drop UI with a low code interface (and code mode for more advanced users)
- Simplified data querying (using machine learning and natural language technologies)
- Straightforward dashboard and report building (via drag and drop design canvas)
Whether it’s building a dashboard, reading a report, visualizing data into a graph or chart, or sharing insights with others, self-service analytics tools make the process of basic data analysis as accessible and powerful for the average person as it is for a trained analyst.
What are the benefits of self-service analytics?
Self service analytics fill the gap caused by the shortage of trained analysts that many organizations face today, by ensuring the benefits of data analysis are available to more people who need it for decision-making. Adopting a BI solution with tools that truly are ‘self-service’, such as Yellowfin BI's Guided NLQ capability, brings a number of advantages to your business or user experience of your software, including:
Better decision-making
Providing self-service analytics improves accuracy, agility and efficiency for decision-making by delegating analytics tasks directly to the business users who are experts in their field or sector, and who have a deeper understanding of the data in question. It also fosters better communication and collaboration among business and technical people.
Data-driven cultures
Analytics solutions that provide true self-service data visualization, dashboards and other analysis tools allow more people to read, manipulate, share and evaluate their data without having to rely on experts to create and/or explain reports for them. The emphasis on simplicity and streamlined tools means the average self-service data analytics user can explore and use their data for decision-making more quickly than with traditional solutions, avoid analysis paralysis, and improve their data literacy and analytical skills for better data-driven workflows.
Reduced reliance on experts and intuition
Providing your users or customers access to self-service dashboards and reporting means they won’t need to request assistance from a centralized analyst or IT team every time they need to build a report or find answers in their data. Making the process of data analysis as simple and accessible as possible means they won’t rely on intuition for their decisions, and more likely they will consistently engage with and use the analytics solution you provide.
Speedier analysis and reporting for analysts
Self-service analytics also helps your advanced or technical users (analysts, IT, developers) because it frees them up from having to explain data or build reports, so they can focus on more important strategic initiatives such as strengthening data security and data governance, or driving innovation elsewhere in the business or software product lifecycle. Additionally, when they use your newly invested self-service analytics suite, they can leverage its streamlined capabilities to the fullest to speed up their typical data cleansing, report building and analysis processes.
Learn More: 5 Key Benefits & Advantages of Self-Service Analytics
What are the challenges of self-service analytics?
In 2024, overall analytics adoption increased from 35% to 50%, driven by augmented analytics solutions that make these tools self-service and accessible for more people, according to Gartner.
However, while self-service analytics solutions are driving the value of BI platforms and data analysis to more people than ever before, realizing all their benefits can only come after your organization or product team are able to meet several considerations.
Clean data
Your average end-user will only be able to find actionable insights with their self-service BI tools if what they explore is accurate in results and reliable for decision-making, making the process of cleansing and curating data to prepare it for analysis an essential process. Typically, this involves preparing a data catalog or semantic layer to map complex raw data-sets into easily identifiable categories for the average business user to explore with ease.
Data security
As an extension of cleansing data, your IT or development team must be able to maintain data governance over data-sets so that the proper role-based access controls, user permissions and protections can be put in place over what data is made available for reporting. This also has the added benefit of establishing proper data governance and security over what data is available for reporting. Maintaining different self-service capabilities without management and control frameworks to govern self-service analytical content is one of the top reasons for self-service analytics failure, according to Gartner.
Collaboration and communication
Just because the BI solution you offered touts self-service analytics doesn’t mean your users will be able to get up and running with its tools right away. It’s the responsibility of your team to communicate to end-users each facet of the analytics solution, the value it presents and how it simplifies their workloads to ensure they engage with the tools and share data, breaking the data silos of traditional IT-centralized BI.
Poor data culture and data literacy
It’s important to carefully guide the transition from traditional BI to self-service analytics if your existing data culture is prone to resisting change or data knowledge in general is low, as the value of the new technology solution adopted must be made clear and understood by all if you are to guarantee its use among your intended user base.
Read More: Before You Embed Analytics - An Essentials Checklist
Why is self-service analytics important?
Everyone needs to be able to explore, consume, share and get value from their data.
For enterprise, this need applies to everyone in your organization - not just your analysts, developers, or technical staff, but also your non-technical business users and C-suite.
For product owners, having self-service analytics is also important for your customers - if they can’t actually use your software application’s in-built analytics, how can they gain value from it?
The point of self-service analytics is to open up the ability to perform data analysis and find actionable insights to more people aside from trained data analysts, and reduce your non-technical users’ reliance on IT or analysts to create or explain their reports for them.
The reality is data is rapidly growing in both complexity and quantity. Self service analytics means you can help make important data more easily available to every type of user.
How do I deploy self-service analytics?
The most important aspect of getting self-service analytics right is to match the type of tools to your intended user-base’s ability. Less technical users have a varied range of analytical ability, for example, meaning your enterprise or product team need to establish the right level of capability, support, permissions, and access rights and privileges offered for each type of user you have.
Building vs buying analytics is relevant to the self service analytics discussion, too. Building analytics tools in-house requires significant investment and expertise, and going another step further to build tools that everyone can use is a big task, which is why we recommend assessing specialized analytics vendors that provide ready-made self-service tools for all markets.
There are typically three analytics personas to cater for when it comes to adopting self-service analytics solutions:
1. Consumer: This is the average non-technical business user who can read, drill down, sort, filter and share analytic content (dashboards, reports, visualizations, etc) that is built for them. Because they typically can’t or don’t build reports, they only require streamlined BI tools that make the consumption of pre-built data, and further analysis of that same data for insights, as simple as possible, and don’t need formal content creation rights.
2. Explorer: This is a business user with intermediate experience with analytics tools and reporting. They use pre-built data models similar to consumers, but can also visually explore data, create dashboards and visualizations, and share data on their own.
3. Expert: This is an advanced user or data expert who uses sandbox environments within analytics tools to prototype new data sets, build data models and create reports for others that aren’t already accessible or established. Self-service analytics tools are still important for this group as it can help them spend less time building data models and reports and more time sharing insights and innovating using data-driven results.
When adopting a self-service analytics solution, it’s important that you ensure collaboration between IT and the business to assign the most appropriate analytics tool-set and data governance for each type of persona. Consumers don’t need more complex augmented tools or privileges to data-sets as other groups, for example, while experts may not automatically need to have access to content with sensitive information just because they’re in the expert bucket.
What to look for in a self-service analytics platform?
Key considerations to make while selecting a self-service analytics platform include:
Ease-of-use: A self-service analytics platform should enable fast access to and analysis of data. It should have a simple, easy-to-use interface. Ease-of-use is essential so that your users may acquire data without having to go through several steps. This increases productivity and efficiency by empowering users to make well-informed decisions quickly based on real-time data. Furthermore, the platform needs to facilitate a variety of data sources, guaranteeing all users have access to thorough analytical capabilities.
Scalability: It's imperative that your self service analytics platform grows with your business. Modern companies need scalable platforms because they can adjust to the constantly changing needs of businesses. These systems need to be able to handle growing numbers of users, complicated analytics, and data quantities without sacrificing speed or user experience. This way, as your company expands, so do your analytics capabilities.
Flexibility: Platforms for self-service analytics must be flexible enough to let users create highly customized reports without the help of IT or other departments. This kind of flexibility is necessary to quickly reach data-driven decisions. This independence boosts productivity, shortens reaction times, and gives users the ability to use data insights to inform strategic choices. Organizations may encourage a culture of informed decision-making at all levels by democratizing data access.
Security: Any firm that allows unauthorized access to data runs the risk of tragedy. That's why having strong data security measures in place is crucial for your self-service analytics platform. Self-service analytics solutions must have at least GDPR, ISO 27001, SOC 2 Type II, and Privacy Shield Framework certifications. You can contribute to data protection, and stop unwanted access, by making sure your platform complies with these requirements.
What features most self-services analytics BI tools include?
Although there are many functions expected from modern self-service analytics tools, there are three crucial functions to account for:
1. Provide business teams with simple ways to access data
It might be scary for company stakeholders to use an analytics tool for the first time. Even when SQL is not required, users may log in, explore, and lose their minds on what to do next. A great self-serve analytics system is easy to use and provides extremely clear directions on where, when, and how to get started. The interface should be simple to use and walk users through the data analysis process step-by-step in order to enable this. Interactive lessons and tool-tips may be quite helpful in deciphering the first investigation. Giving consumers samples of typical reports and queries encourages them to explore their data further without feeling overwhelmed.
2. Business teams must be able to examine data
When businesses confuse self-service with dashboards, they miss out on an essential aspect of self-service: data exploration and digging down capabilities. A sudden rise or fall in data cannot be explained by dashboard analysis alone. In order to enable users to scrutinize the data more thoroughly, charts ought to be divided and reconfigured in several ways. Organizations that ignore this deprive their users of the ability to see trends, abnormalities, or insights that might inform strategic choices. A thorough investigation requires interactive tools like sorting, filtering, and rich data visualization. By making data more available, this strategy not only increases user engagement but also promotes a data-driven culture in which choices are made after careful analysis of the data rather than a cursory glance.
3. Give data teams access to sophisticated analytic tools
Strong, adaptable, and iterative analytical processes must be offered by analytics as a service platform that touts self service analytics tools in addition to visual assistance. Visualizations need to be adaptable and have a high technical ceiling so that analysts may input raw data as needed for this to function.
These tools should also have user-friendly interfaces that make it simple for users to work with and change the data, promoting a deeper comprehension of the conclusions drawn from it. Additionally crucial are sophisticated features like real-time data processing capability, machine learning integration, and automated business monitoring. These features enable users to predict future patterns in addition to analyzing historical trends, which improves decision-making.
How does a self-service analytics strategy work?
To make effective use of self-service analytics and ensure your investment provides value to your end-users, your organization must implement a robust self service analytics strategy. Several self service analytics platform vendors, such as Yellowfin BI, can help you build your self service analytics tools adoption and strategy and align it with your business goals. To get you started, here is a general framework that you can follow when adopting self-service analytics:
1. Initiate your self-service analytics journey
To establish a self-service analytics strategy, the first step is to select tools that align with your organization's needs. Choose intuitive BI platforms that empower users to access, analyze, and visualize data independently. Define clear goals for your analytics strategy to ensure realistic alignment with business objectives. Starting small with pilot projects can help test the approach and fine-tune processes before scaling across the organization.
2. Provide users with training and resources
A successful self-service analytics strategy depends on user competency. Invest in comprehensive training programs that teach employees how to use analytics tools effectively. Create an ongoing support system with accessible resources such as tutorials, documentation, and help desks. This empowers users to gain confidence and encourages adoption across departments, fostering a data-driven culture. In addition, select a self service analytics solution vendor that provides training, support, expertise, and resources to make your overall adoption of the new self service analytics platform more streamlined.
3. Evaluate and prepare data for analysis
A strong self-service data analytics strategy begins with clean and reliable data. Conduct thorough assessments to identify inaccuracies, duplicates, and gaps in your datasets. Implement data cleanup processes to ensure the information is accurate and ready for analysis. Streamlining and organizing data sources improves efficiency and minimizes errors, enabling users to generate actionable insights quickly.
4. Establishing a data governance framework
Data governance plays a crucial role in maintaining the integrity and security of your analytics strategy. Form a data governance committee comprising representatives from various departments. This committee sets policies, establishes data access controls, and ensures compliance with regulatory standards. A structured governance framework helps balance accessibility with security, empowering users to work confidently with trusted data.
What self-service analytics solutions exist?
In the past, most BI software was designed around data scientists and technical personas. Now, modern BI solutions, such as Yellowfin, offer sophisticated analytical capabilities and tools that are specially tailored for both regular users and trained experts - the best of both worlds.
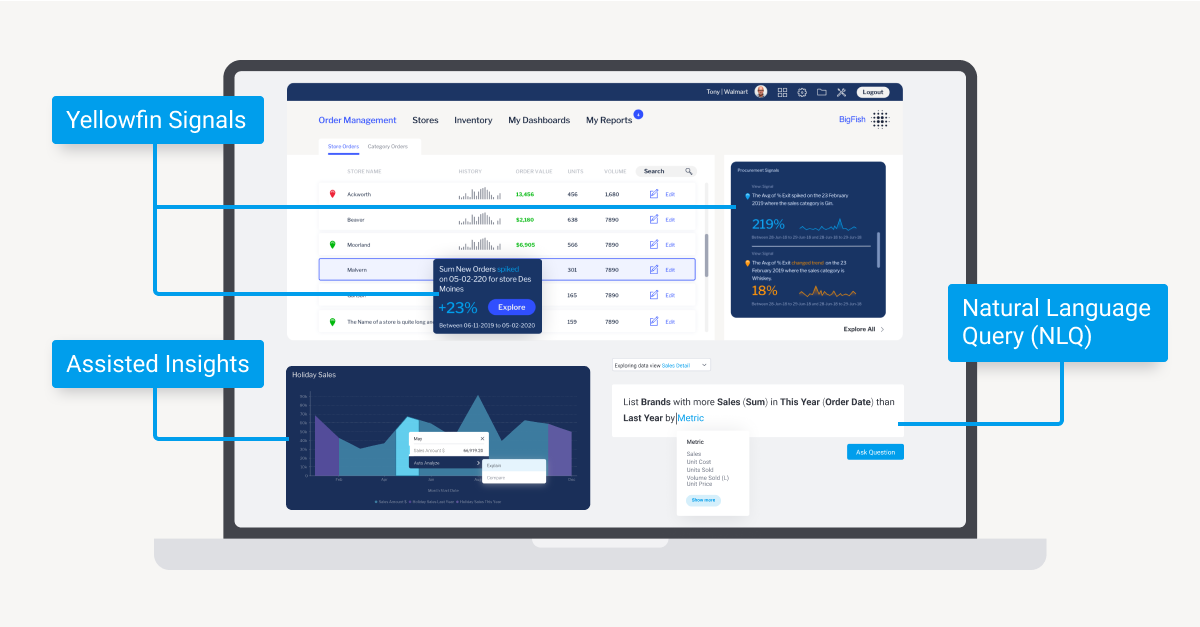
The Yellowfin platform currently provides several types of tools, leveraging sophisticated AI, machine learning and natural language technologies, that enable anyone to create reports, from the experienced data professional to everyday non-technical business user. Even people who have no prior experience with analytics can begin using our suite, helping open up data-driven analysis and decision-making to more people.
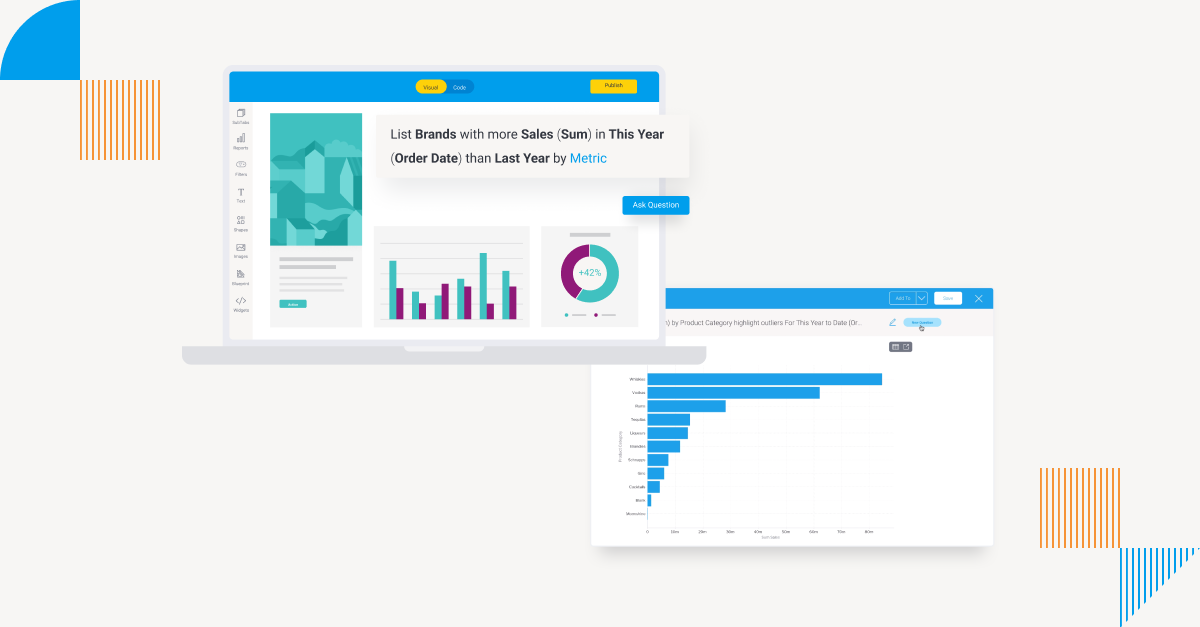
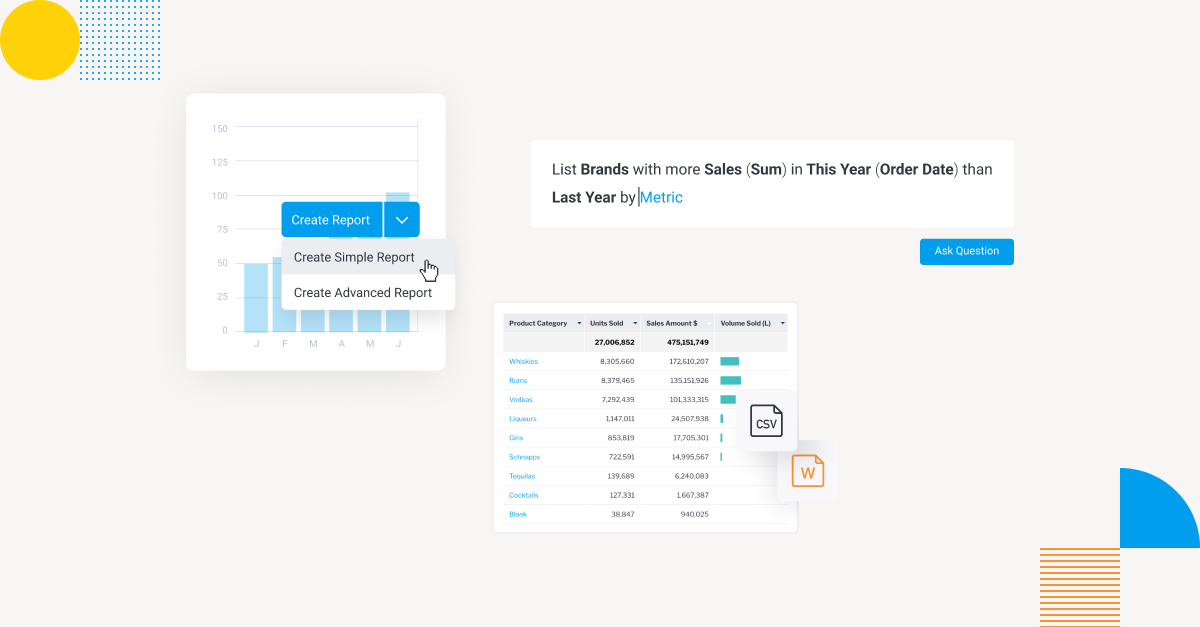
1. For business users (consumers): Guided Natural Language Query (Guided NLQ)
2. For intermediate analytics users (explorers): Assisted Insights and Quick Charts
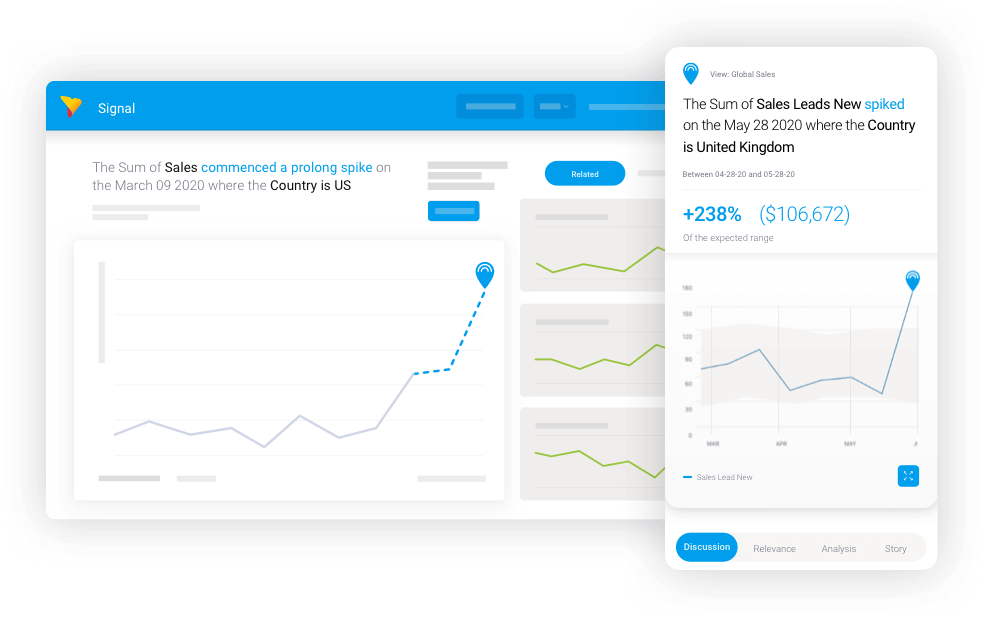
3. For data analysts (experts): Advanced Report Builder and Yellowfin Signals
Self-service analytics FAQs
Who is the ideal user for self-service analytics?
Self-service analytics is best suited for those who see the value of data but lack the technical know-how to handle and sort through large amounts of data. This is often a business user, such someone who works in supply chain, manufacturing, marketing, sales, or finance. These consumers are aware of the possibilities that data offers; all they need is a simpler method for analyzing data and producing insights.
How is self-service analytics different from traditional analytics?
In a conventional analytics approach, a business user must request a data collection with a specific objective in mind. That request might be delayed in IT's queue for so long that it costs the company money. By switching to self-service analytics, the user may run an application, load a dataset, specify parameters and dimensions, and work with the data to see what kinds of insights, reports, and visualizations come out.
What are self-service dashboards?
With a self-service solution, users may create dashboards and reports and carry out independent analysis. This frees up IT time for high-value tasks like maintaining data governance, making sure data is accurate and consistent, and giving mission-critical application development first priority.
Why self-service analytics is a must-have
Deploying self service analytics empowers your business and/or software product customers with easy, intuitive BI tools to make better and faster business decisions. It’s a critical element of any organization today who wishes to democratize access to data and insights for everyone.
If your goal is to drive more data-driven decisions and value for your product or organization, investigating how self-service analytics can help you is key to your checklist.
How do AI and machine learning help self-service analytics?
Artificial intelligence (AI) and machine learning (ML) can further transform the potential of self-service analytics by automating data preparation and uncovering hidden patterns. BI vendors that incorporate these technologies as part of their self-service analytics offering are able to provide data analysis tools that can generate personalized recommendations, simplify complex tasks, and make data-driven decision-making more accessible to all users, empowering your organization to act quickly and effectively on insights.
Several self service analytics solutions, such as Yellowfin, provide AI analytics (also known as augmented analytics) and generative AI tools as part of their overall analytics suite.
Self service analytics: How to get started
See how real users today are taking advantage of sophisticated, streamlined, self service analytics with Yellowfin - or try our free trial.