

4 data analytics predictions driven by COVID-19
The COVID-19 global pandemic has changed the ways we work, including how we use data, forever. Amidst the crisis, the analytics industry is experiencing its own paradigm shift.
While the analytics sector has largely lacked dramatic innovation over the past two decades, it has seen several innovations spurred by the crisis. In this blog, Yellowfin CEO Glen Rabie shares his four predictions for the business intelligence (BI) industry based on this continuing trajectory.
Trend #1: The rise of the augmented consumer
The rise of the augmented consumer, a new paradigm shift in thinking for business intelligence (BI) and analytics vendors, will see embedded and contextual analytics drive the analytics space.
Historically, many solutions have been built around an analyst’s skill-set, limiting the effectiveness of self-service BI for non-technical business users. Now, BI solutions are introducing new features specifically made to augment the business user’s analytical experience. These tools leverage automated, contextual, mobile and natural language capabilities to help make BI a more streamlined, guaranteed part of their workflow.

Predefined charts and reports have traditionally been considered by businesses as the primary method for analytics users to monitor, explore and analyze their data. What makes the newly augmented consumer different is that they no longer have to rely on static, high-level dashboards as their main or only way to analyze their data.
Instead, users now have easier access to sophisticated augmented features like automated alerting and natural language query (NLQ) when exploring their data, which actively help show, explain and analyze data for them.
Read more: What is the augmented consumer?
Trend #2: Consolidation of established BI vendors will continue
Off the back of the rise of the augmented consumer, significant industry consolidation is expected to continue in 2021 and beyond. We’ve already seen several major data analytics vendors acquired by enterprise software stacks, such as Chartio (bought by Atlassian in February 2021), and Izenda and Logi Analytics (bought by insightsoftware in April 2021).
The fact is business analytics is becoming a core priority for enterprise software offerings, and more leaders are seeing the value of providing BI capability to all of its end-users, not just its data-versed experts.
Trend #3: More opportunity for independent analytics vendors
The increase in consolidation of BI and analytics platforms leaves only a few vendors left standing in the embedded analytics space, such as Yellowfin and Sisense. This will make the market for independent vendors considerably larger, and alleviate competition for its business based on price.
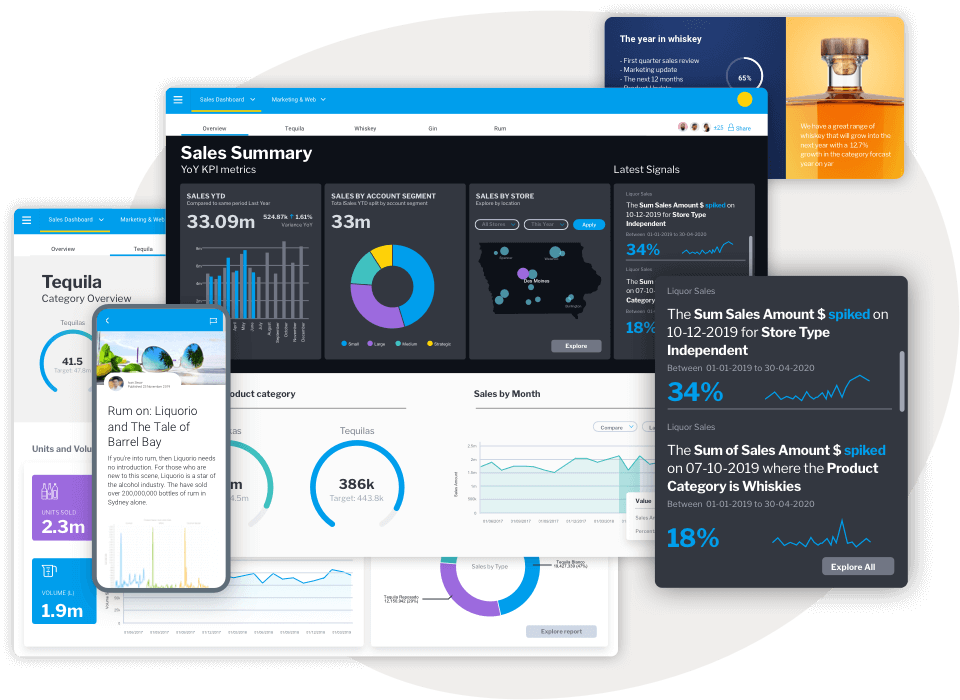
In preparation, Yellowfin is scaling up to take advantage of the opportunity, with its automated business monitoring (Signals), mobile app, data storytelling (Stories, Present) and upcoming natural language query product aligning with the rise of the augmented consumer to offer the most comprehensive embedded analytics suite available.
Read more: Yellowfin vs Sisense - Comparison Guide
Trend #4: Turnkey solutions will be the new normal
There was a 43% increase in inquiries about analytics recorded at the start of the COVID-19 pandemic, according to a leading analyst firm. However, resultant growth across the industry was largely minimal.
With businesses previously creating their own data reporting, the new normal will now see analytics managed with pre-packaged products, also known as turnkey solutions.
Organizations will spend more on business intelligence and analytics capabilities built for their industry or business division, but they will also purchase turnkey solutions that provide immediate value. This is the opposite to how companies previously managed their data, before the global crisis.
How data storytelling and augmented analytics are shaping the future of BI
While the AI and automation capabilities of augmented analytics dominate today’s business intelligence (BI) conversations, data storytelling is fast becoming a hot topic - and together, they’re set to re-shape the future of BI.