
Date Dimensions
28 November, 2013
Hi,
I have changed a metric date field to a dimension in the view and selected the output format as Month.
This works fine, but it is causing issues in a report that I am trying to create that needs to sum transactions by month. I get duplicate rows that seem to represent each different date value.
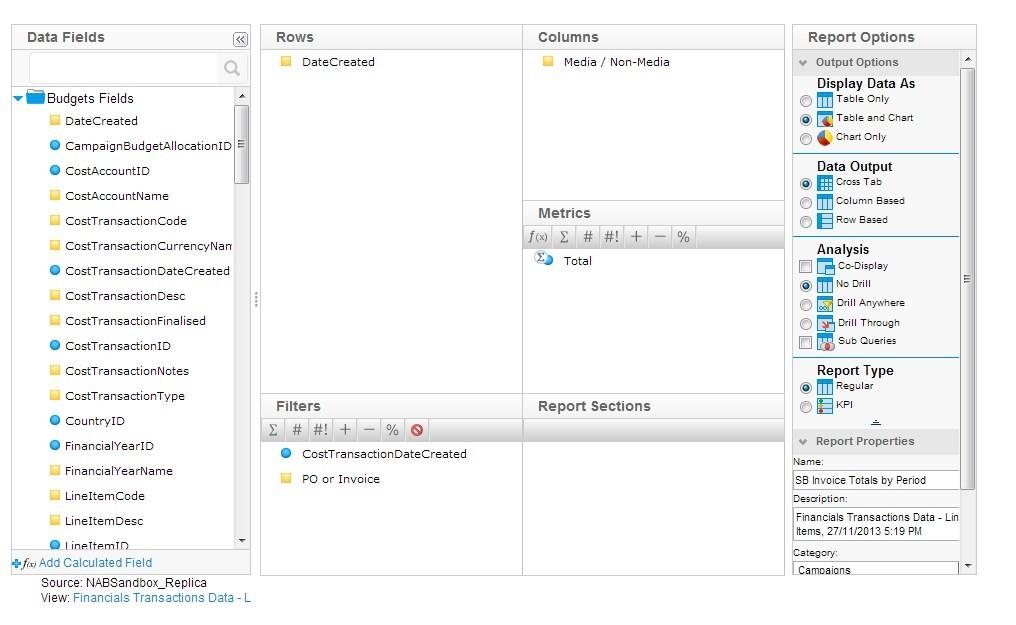
The format of the report is as follows:
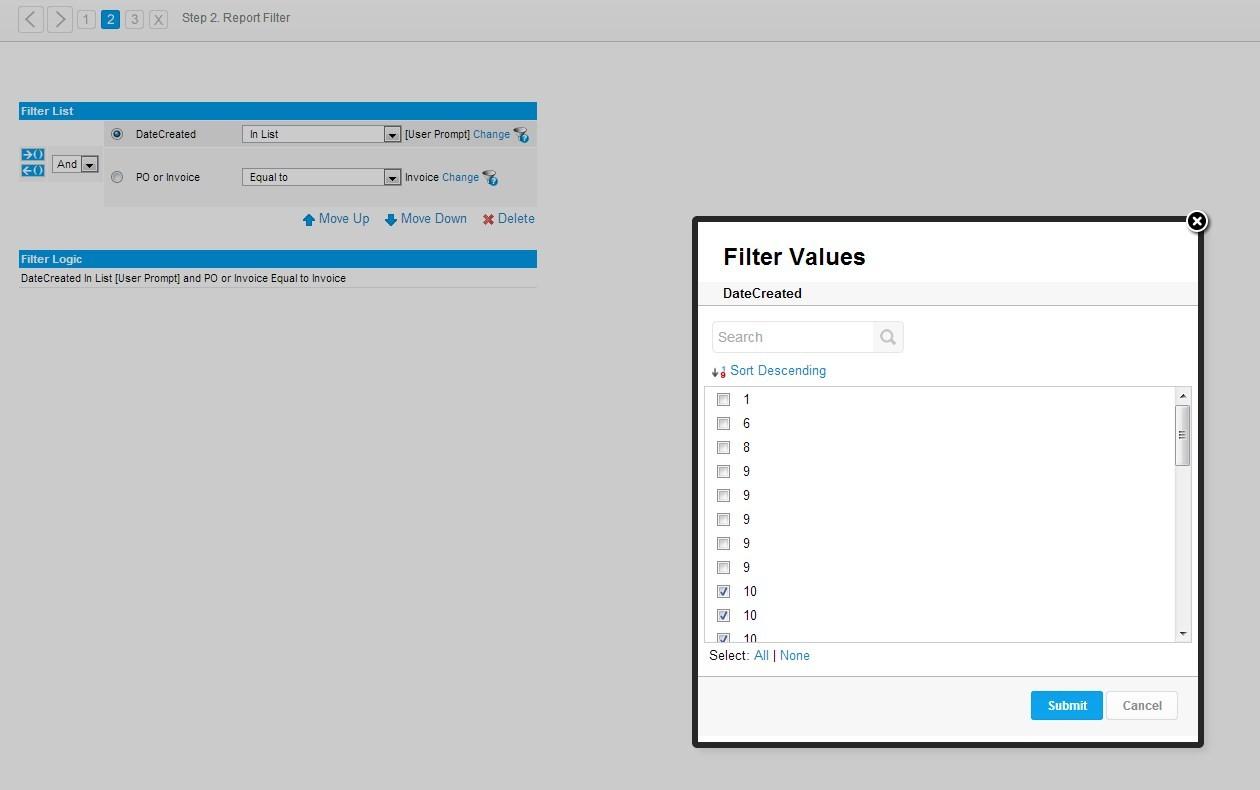
This causes an issue in filtering if I simply want to select a specific month:
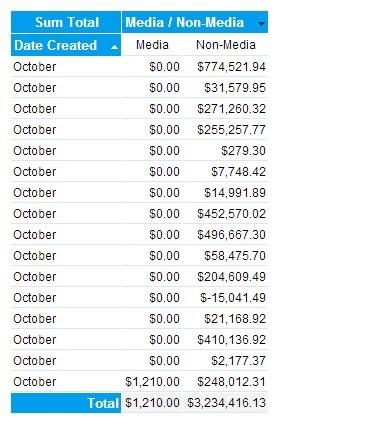
And in the results I cannot seem to suppress duplicates on the month field:

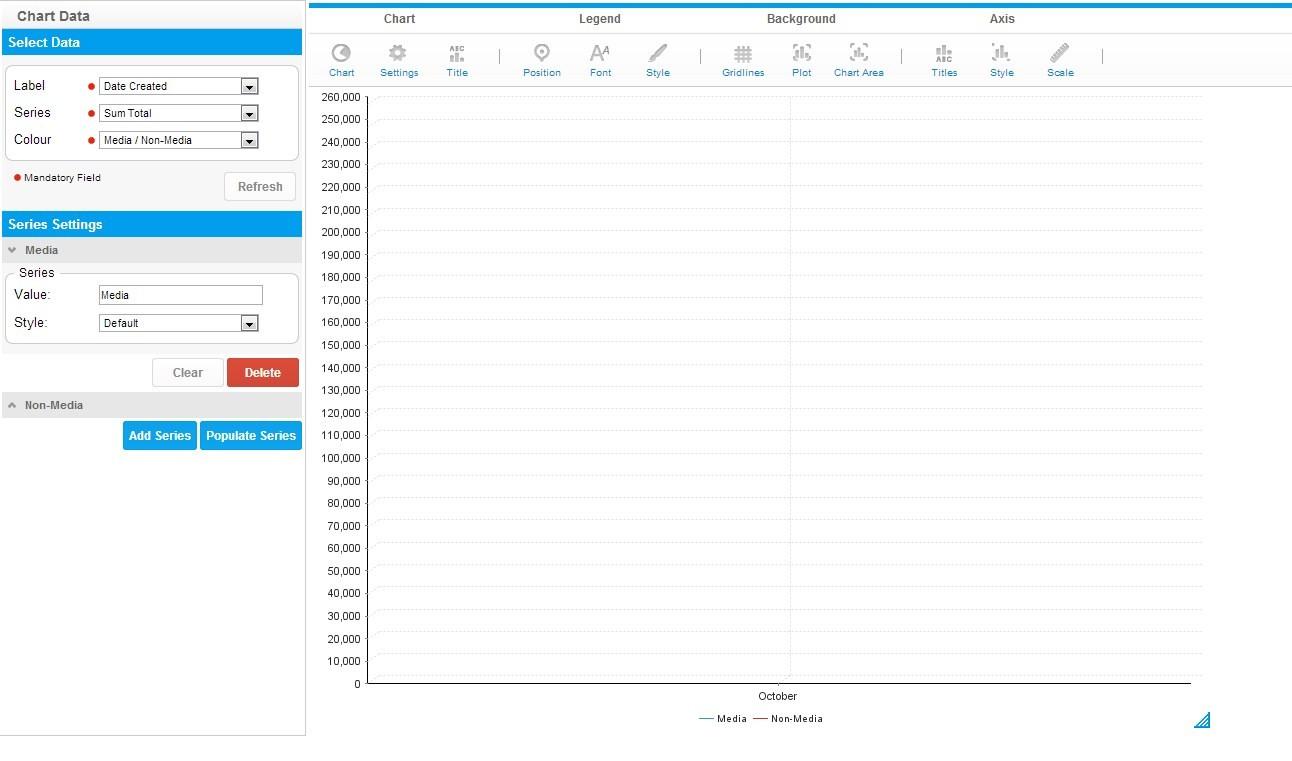
And the data does not seem to be accepted on charts:
Any ideas on how we can use the date field so that I simply get a single sum per month??
Patrick
I have changed a metric date field to a dimension in the view and selected the output format as Month.
This works fine, but it is causing issues in a report that I am trying to create that needs to sum transactions by month. I get duplicate rows that seem to represent each different date value.
The format of the report is as follows:
This causes an issue in filtering if I simply want to select a specific month:
And in the results I cannot seem to suppress duplicates on the month field:
And the data does not seem to be accepted on charts:
Any ideas on how we can use the date field so that I simply get a single sum per month??
Patrick
Hi Patrick
The reason your report is displaying multiple rows for each month is because the underlying data is still a date field and is displaying a row for each unique date.
To achieve what you trying to do, you could convert your date column to the month number using the Date Hierarchy month template, and display the month name using an Org Ref Code.
At Step 2 of your View Builder, add the month function to you available fields and assign the Date column for the function to be based on.
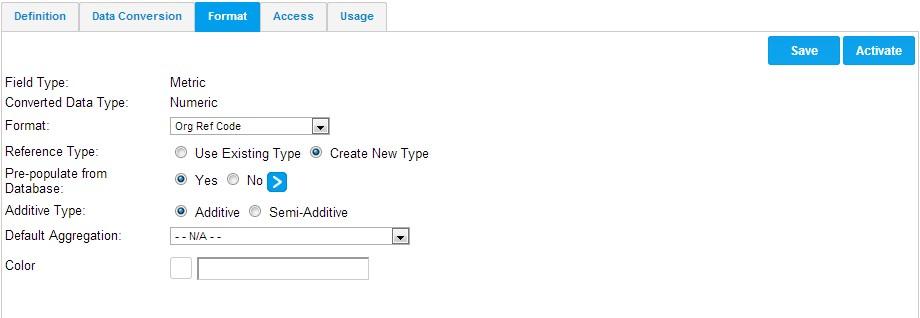
Format the new field using an Org Ref Code, you could pre-populate the values from your resultset.
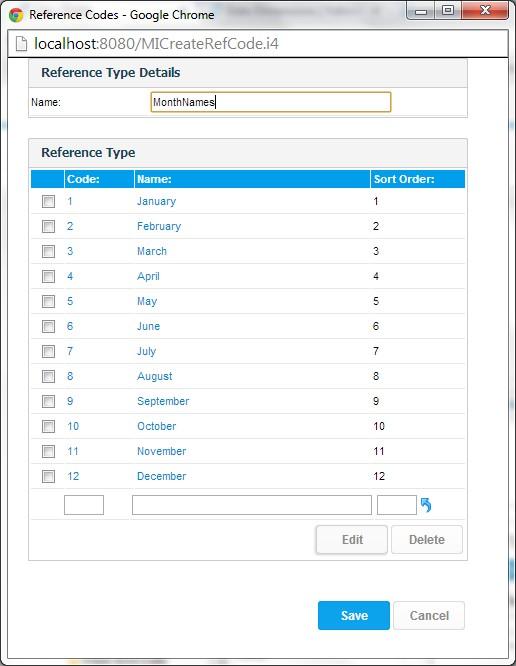
Edit the Month names and the sort order as follows
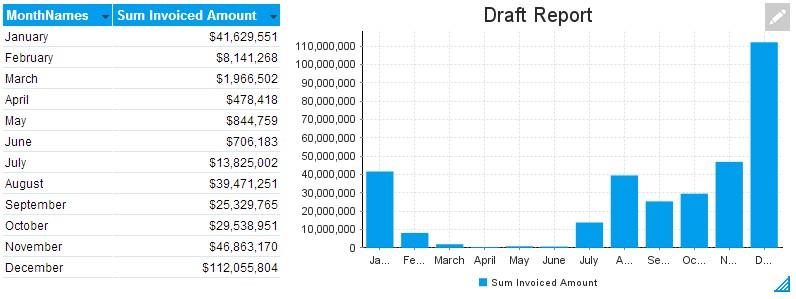
This should give you the results you are after and display correctly in you chart
Please let me know if this is what you were looking for
Regards,
Stephen
The reason your report is displaying multiple rows for each month is because the underlying data is still a date field and is displaying a row for each unique date.
To achieve what you trying to do, you could convert your date column to the month number using the Date Hierarchy month template, and display the month name using an Org Ref Code.
At Step 2 of your View Builder, add the month function to you available fields and assign the Date column for the function to be based on.

Format the new field using an Org Ref Code, you could pre-populate the values from your resultset.
Edit the Month names and the sort order as follows
This should give you the results you are after and display correctly in you chart
Please let me know if this is what you were looking for
Regards,
Stephen
Thanks Stephen,
That has resolved very easily!
Patrick
That has resolved very easily!
Patrick