How to group values using a calculated field at the view level.
11 July, 2011
You can group values brought back from a database at the Yellowfin view level, so that this group can be used for multiple reports.
This will also allow to you use this group as a filter value.
E.g. Ages (1-18 = Youth, 19-36 = Gen Y etc)
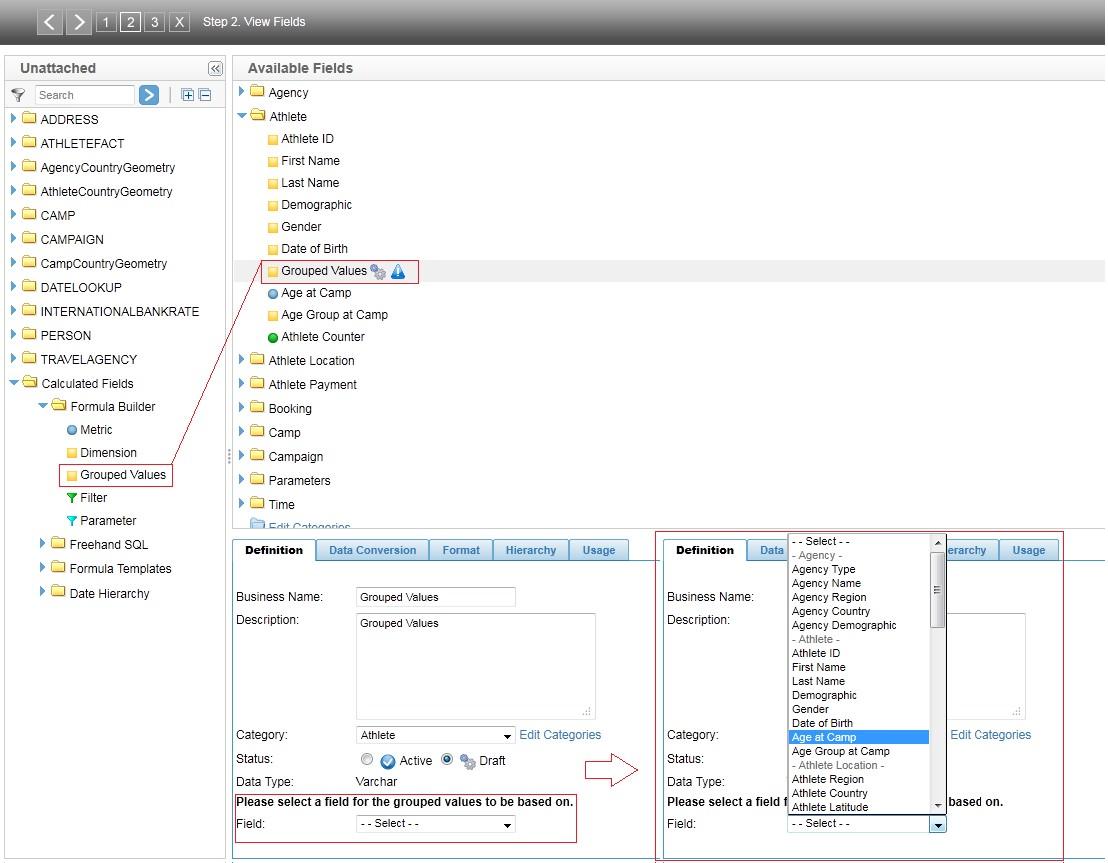
1. To do this, modify the Yellowfin view and go to 'Step 2 - View Fields'.
2. Use the calculated field 'Grouped Values'(on the left pane) and drag it to the 'Available sections' section.
3. Double-click on this field and go to the 'Definition' TAB.
You will need to select the field on which these values are found.
Note: You can also rename the field from this TAB by changing the 'business name'.

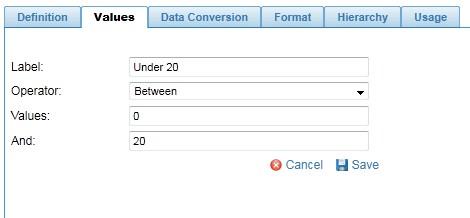
4. With the field selected, you can now go to the 'Values' TAB and select 'Add Group'.
Select the :
Label = Group Name
Operator = Equal to, between etc..
Values = The values themselves (1 , 20 etc..)

Once you have created your group/s , hit 'save' and then 'activate'.
5. Activate the view.
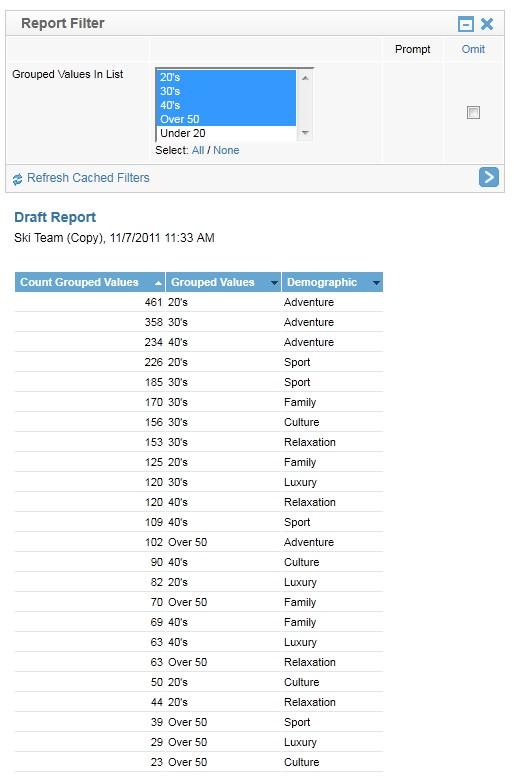
You are now able to use this field in a report, as a display field or a filter.
See report output below :

Hi David
In line with previous discussions here
Is it safe to say that grouping cannot be done on Calculated Fields?
And that Freehand SQL will have to be used to create the groups?
Regards
Samuel
In line with previous discussions here
Is it safe to say that grouping cannot be done on Calculated Fields?
And that Freehand SQL will have to be used to create the groups?
Regards
Samuel
Hi Samuel
You are correct, Grouping cannot be applied to a Calculated Field.
It is possible to create the grouping by using Freehand SQL.
There is however a current support task logged, (TASK # 147660) for this feature to be considered for a future release.
Regards,
Stephen
You are correct, Grouping cannot be applied to a Calculated Field.
It is possible to create the grouping by using Freehand SQL.
There is however a current support task logged, (TASK # 147660) for this feature to be considered for a future release.
Regards,
Stephen
If not Freehand SQL, please go to the access options of the Field and enable grouping. You can group the data accordingly in your chart. :)